Mortgage Rate Price Tracker 🏠📉🔍 (OCT 6 – 31)
Monitoring the change in price of specific mortgage rates

THE TRACKER 🔭
----------------
Most mortgages are sold into mortgage-backed securities (MBS) and the price of these bonds determines rates for all banks and lenders.
However, mortgage rates DO NOT rise or fall. Instead, the price of each rate changes while the rates available to you remain the same.
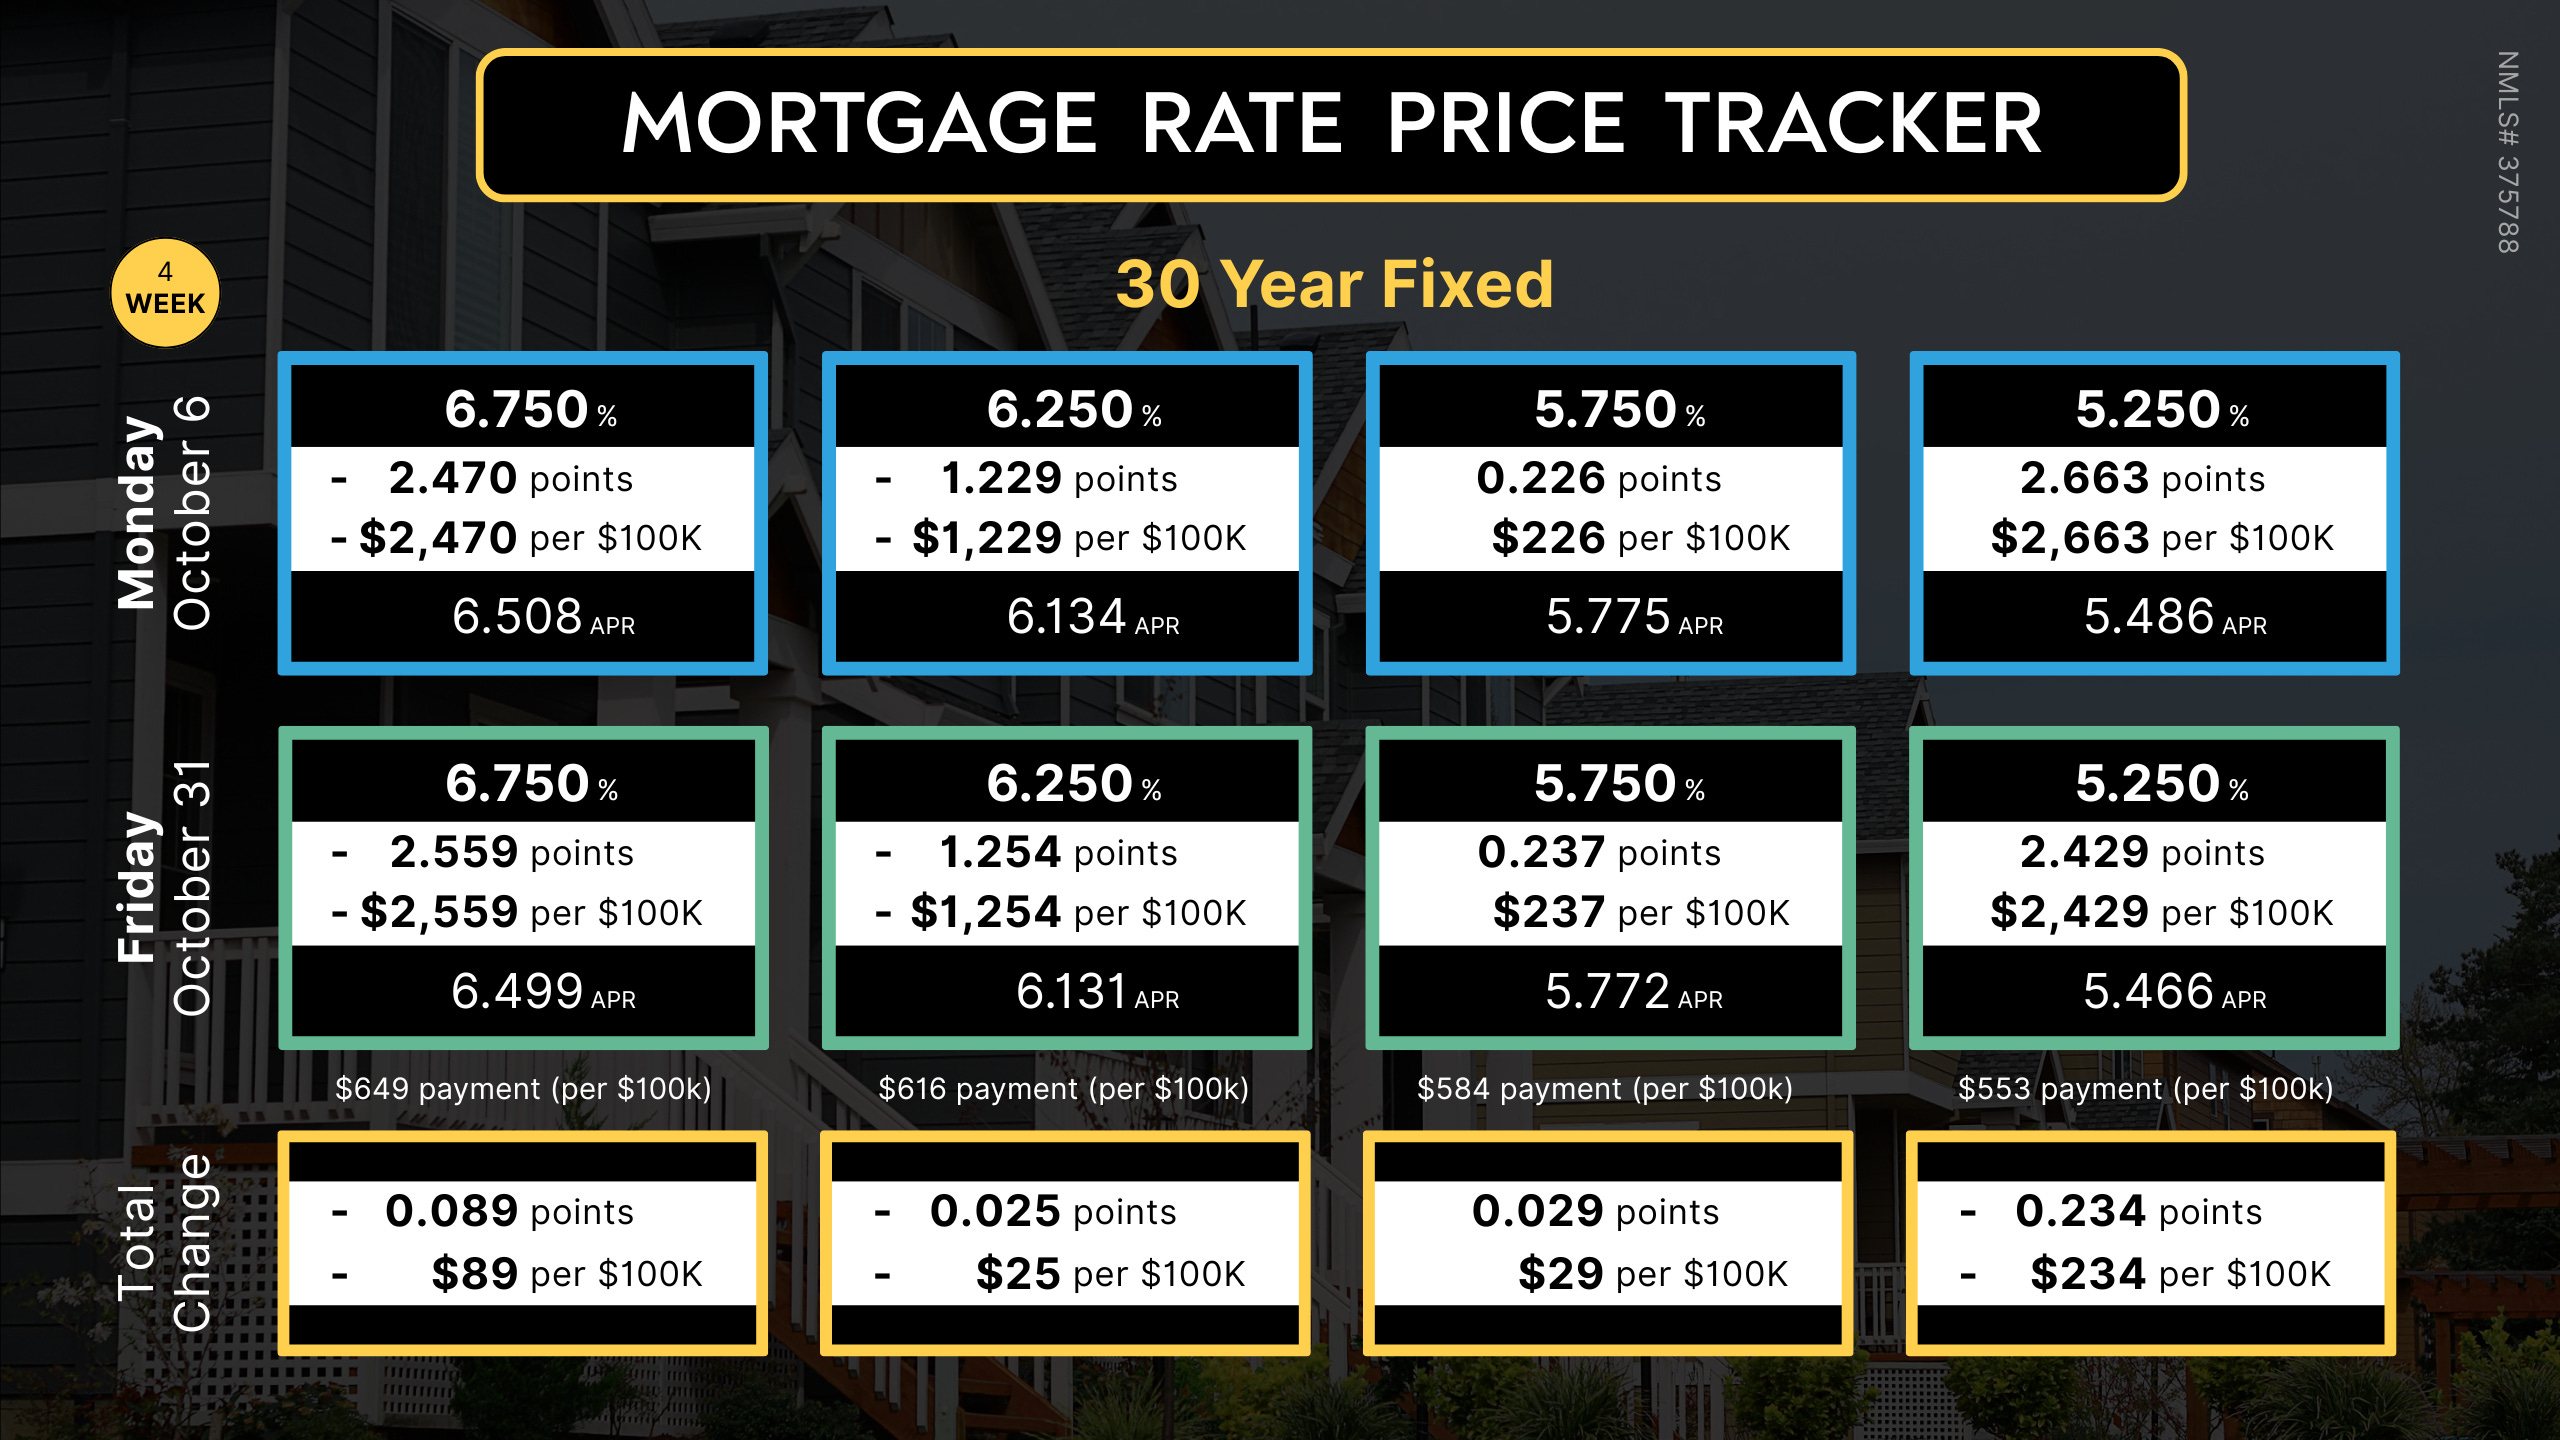
The Mortgage Rate Price Tracker (MRPT) illustrates this dynamic by showing how the price of each rate changed within the time series.
This change is driven by mortgage bonds, not the lender, who will then add their own fees on top.
The higher the rate, the lower the fee (points). Some higher rates pay a rebate; this is illustrated on the tracker with negative (-) points.
When the “total change” is negative it means a reduction in the price of the rate.


The MRPT is a more rate and loan program specific example of the LendZen Index, which monitors a much broader set of rates and mortgage bond coupons.
Both are effective for monitoring how the price of mortgage rates has changed, while the LendZen Index is published daily at LendZen.substack.com

RATE RECAP ⏪
--------------
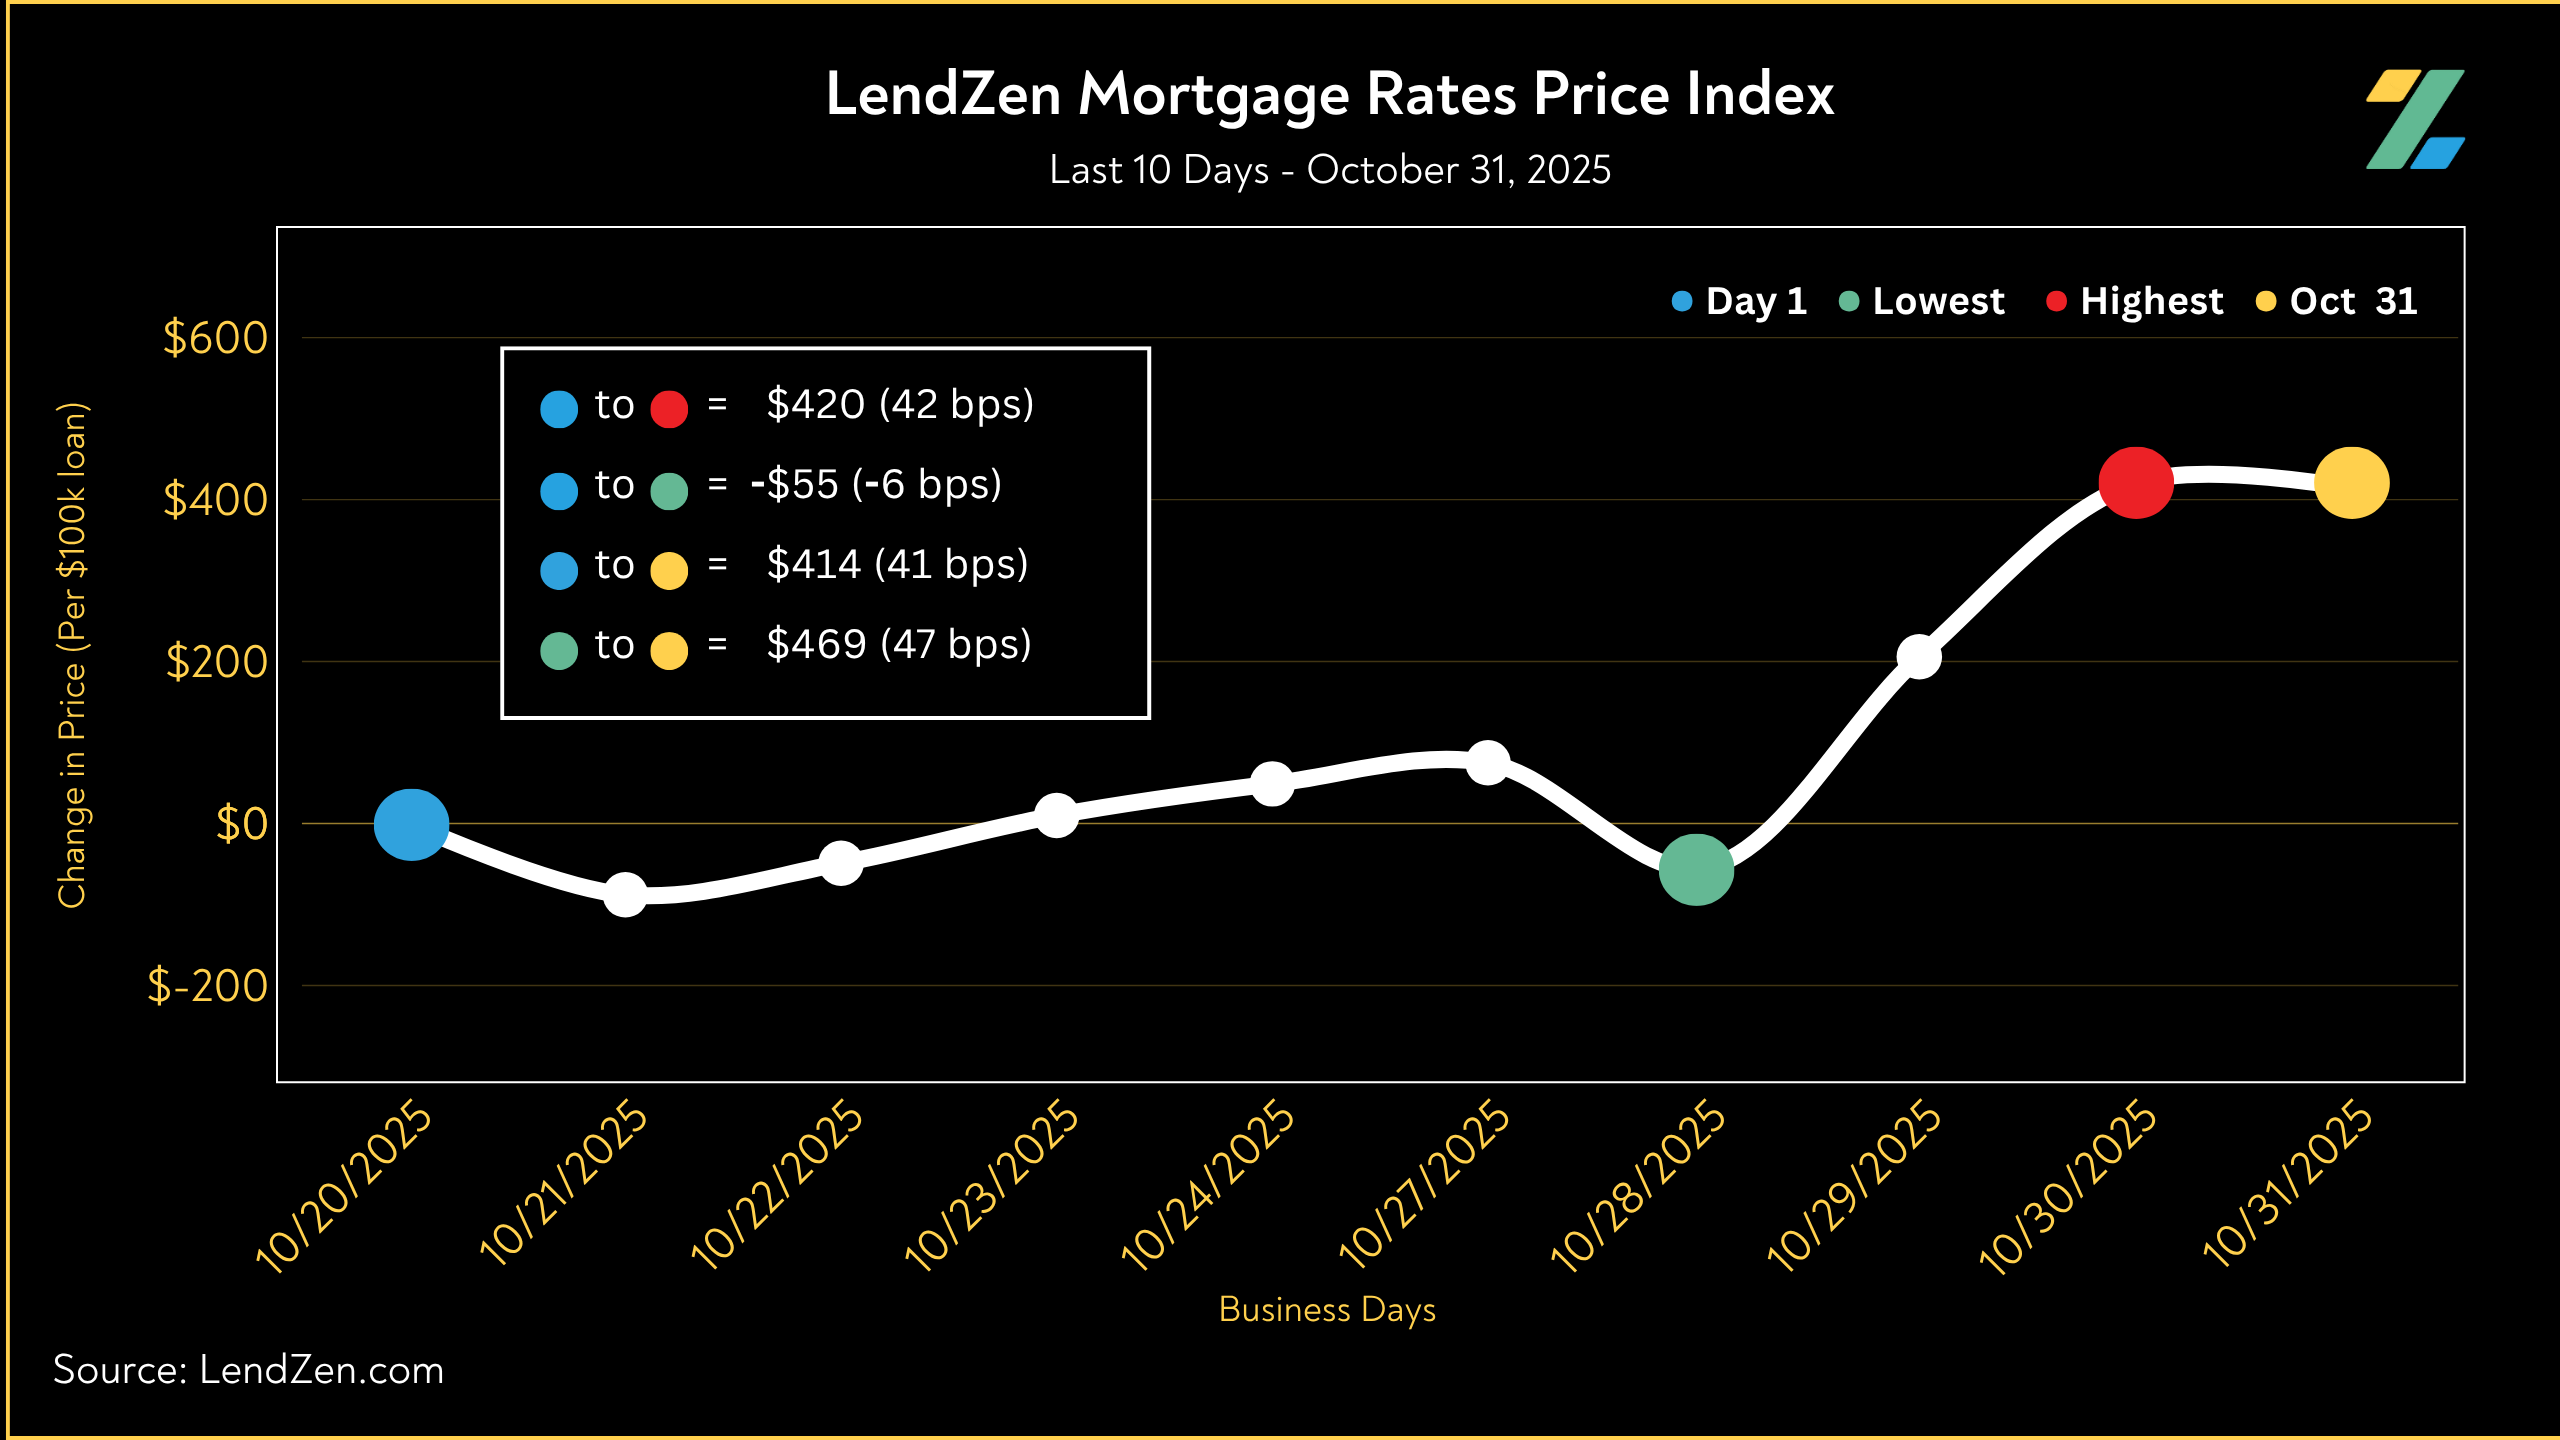
The month of October was a roller coaster ride and is the perfect illustration of how the PRICE of rates changes, yet not uniformly, with the price of each rate reflecting how its correlated MBS coupons were traded.
Unfortunately, most of the improvements from the first 3 weeks were given back.
This occurred within two days, following Wednesday’s Fed rate cut decision and Powell’s “not a foregone conclusion” press conference statement – read more on that in this Substack post.
Despite the midweek damage, Friday ended the day unchanged.
To get a feel for the size of the recent move you can compare today with last week’s MRPT available at this Substack post.
Friday-to-Friday gave back 20 – 60 bps.
This means depending on what rate a borrower was targeting, the cost of their loan is $600 more expensive today, per $100k of loan, than at the close of last week.
That’s a potential jump in costs of $3,000 for a $500k loan.
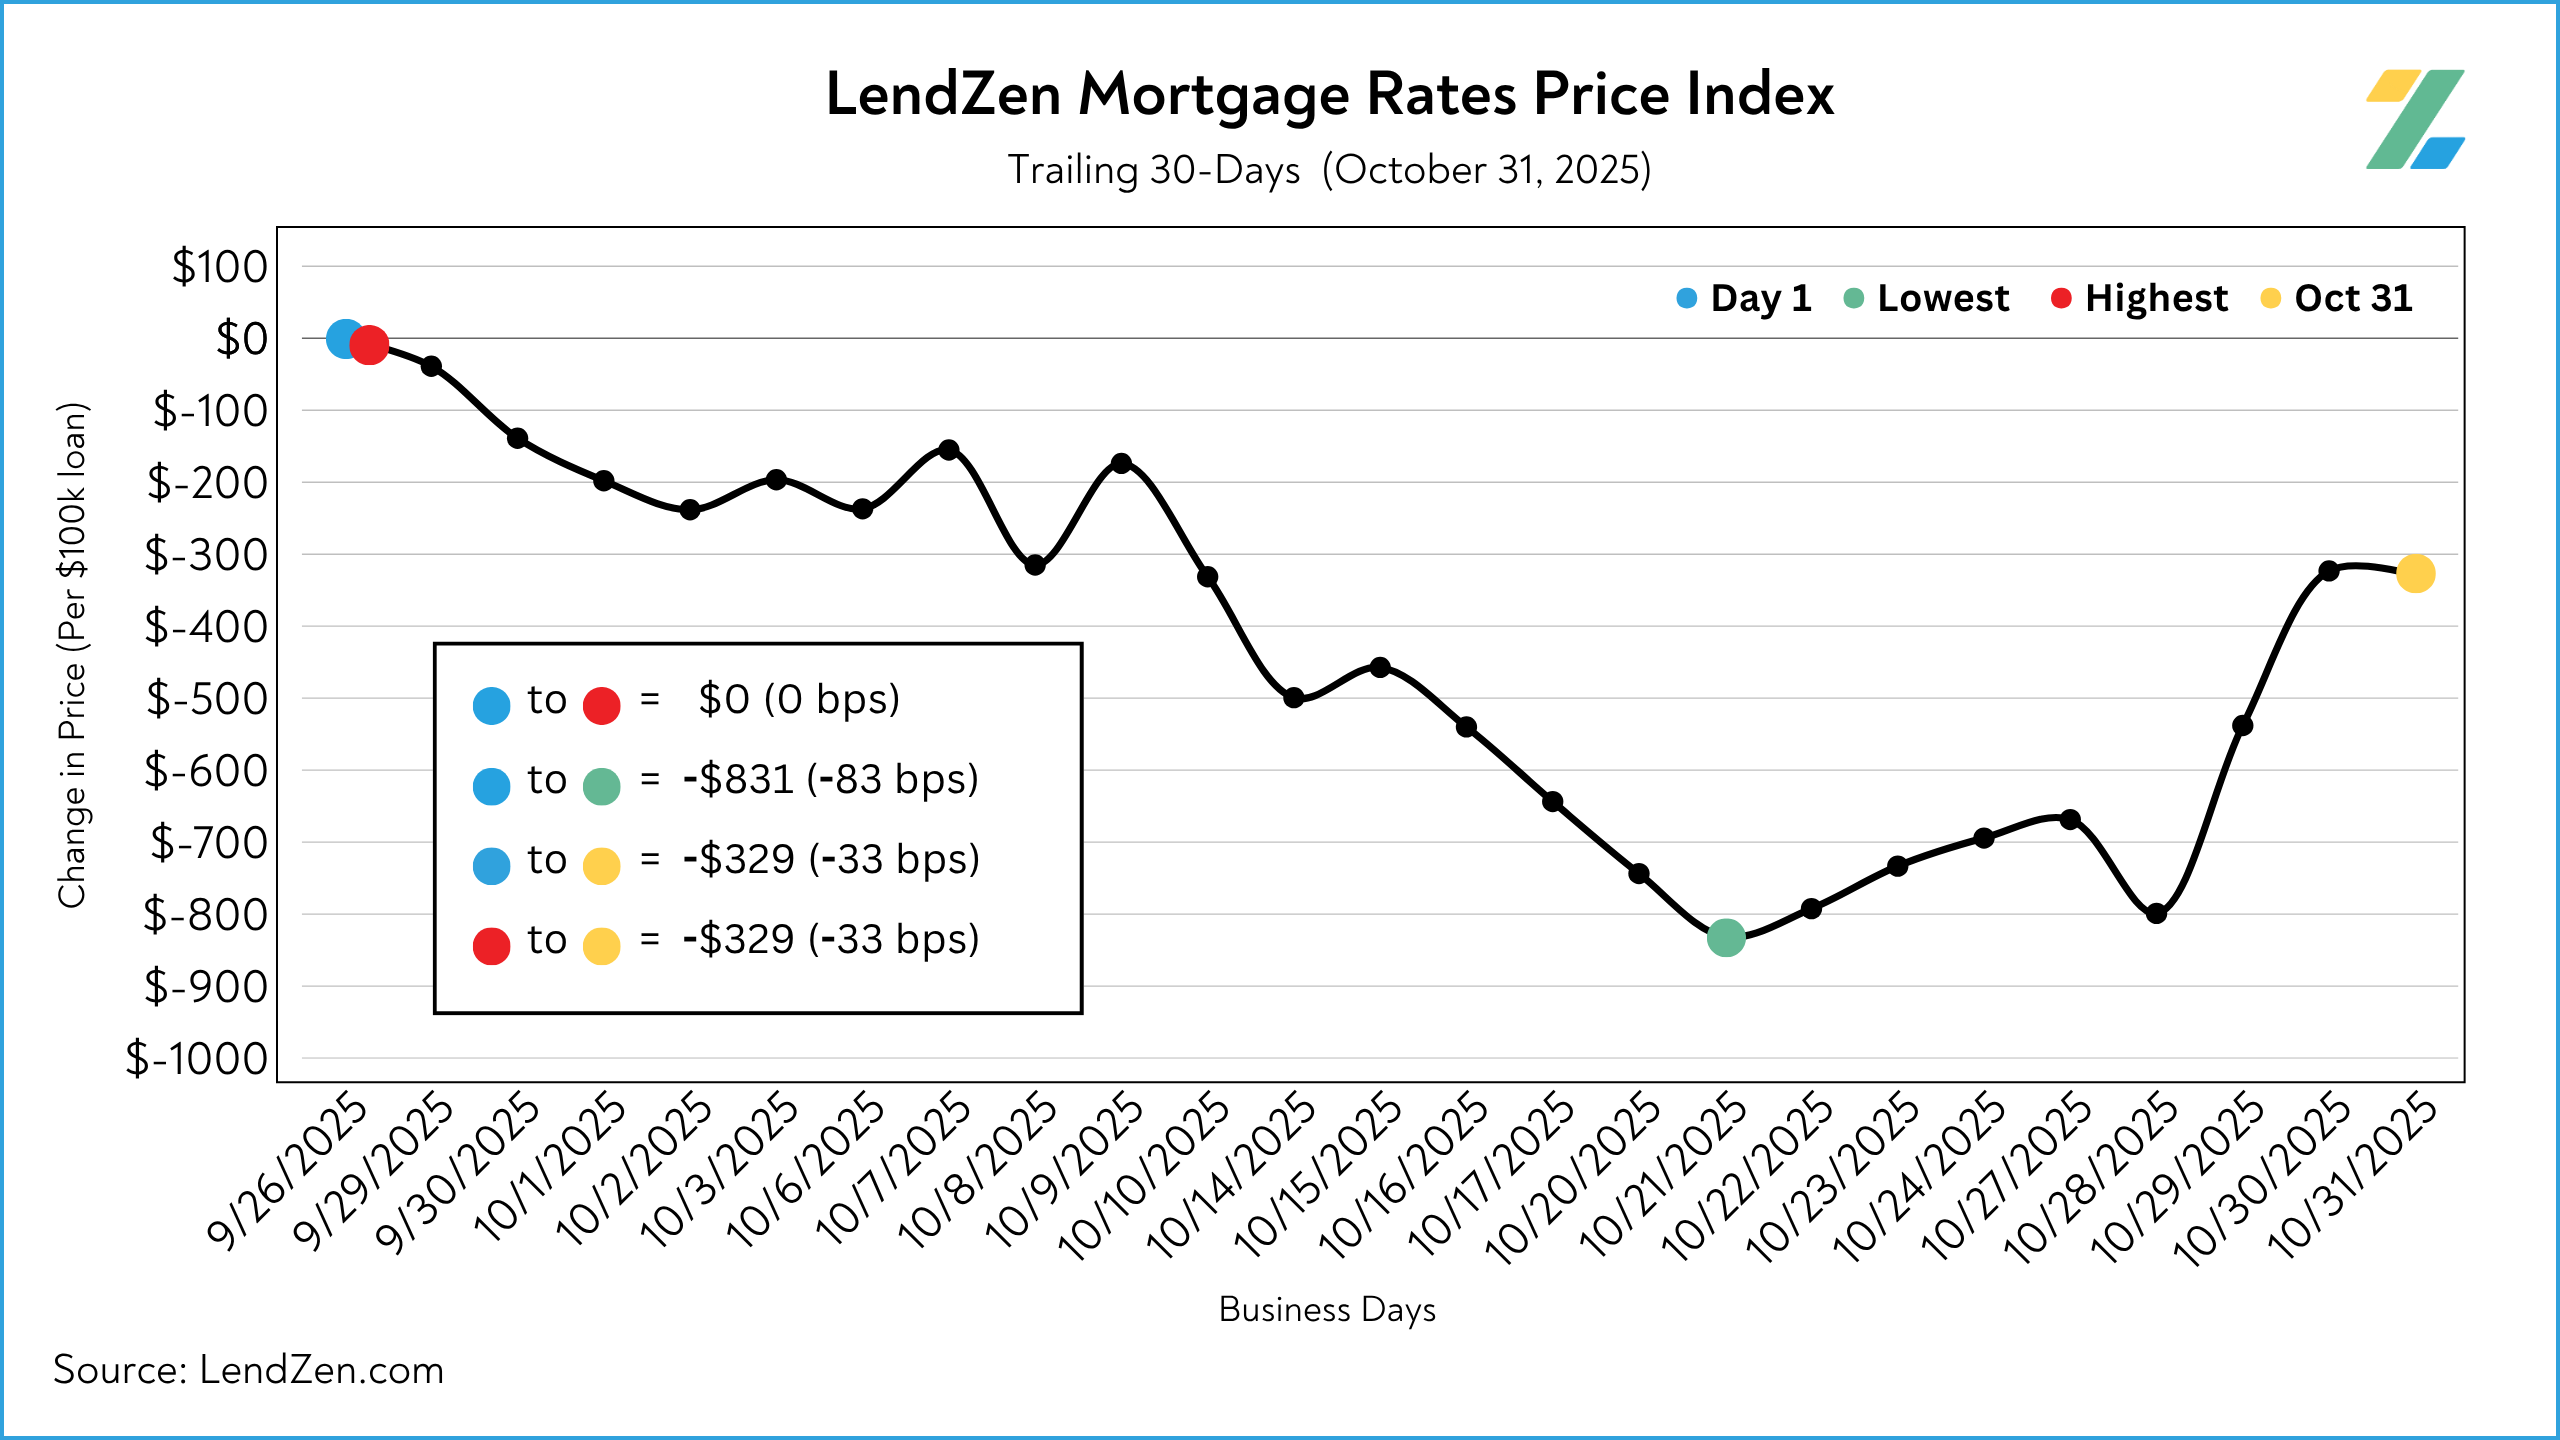
The MRPT provides useful nuance to how specific rates are trending, but the big picture story is crystal clear when we look at the 30-Day chart of the LendZen Index.
It’s a painful visual, but at least the price of rates is still down 33-bps during that time.
UP NEXT 🗓️
----------
Stay tuned for a deeper dive on all the latest rate action, with a full stack of charts and a closer look at the inflation data, in the upcoming Monday Data Deluge.
Next week hinges on whether the lockdown ends, and the Non-Farm Employment data is released (Friday).
Otherwise, we might see more of the sideways grind that dominated recent weeks whenever meaningful data was absent.
The latest Lock-O-Meter risk scores and detailed rate lock recommendations with be posted Monday in the Data Deluge.
Thanks for reading.
If you are interested in more mortgage insights, then I suggest checking out this recent Substack article.

DISCLOSURES
LendZen Inc. is an equal opportunity mortgage lender, NMLS 375788.