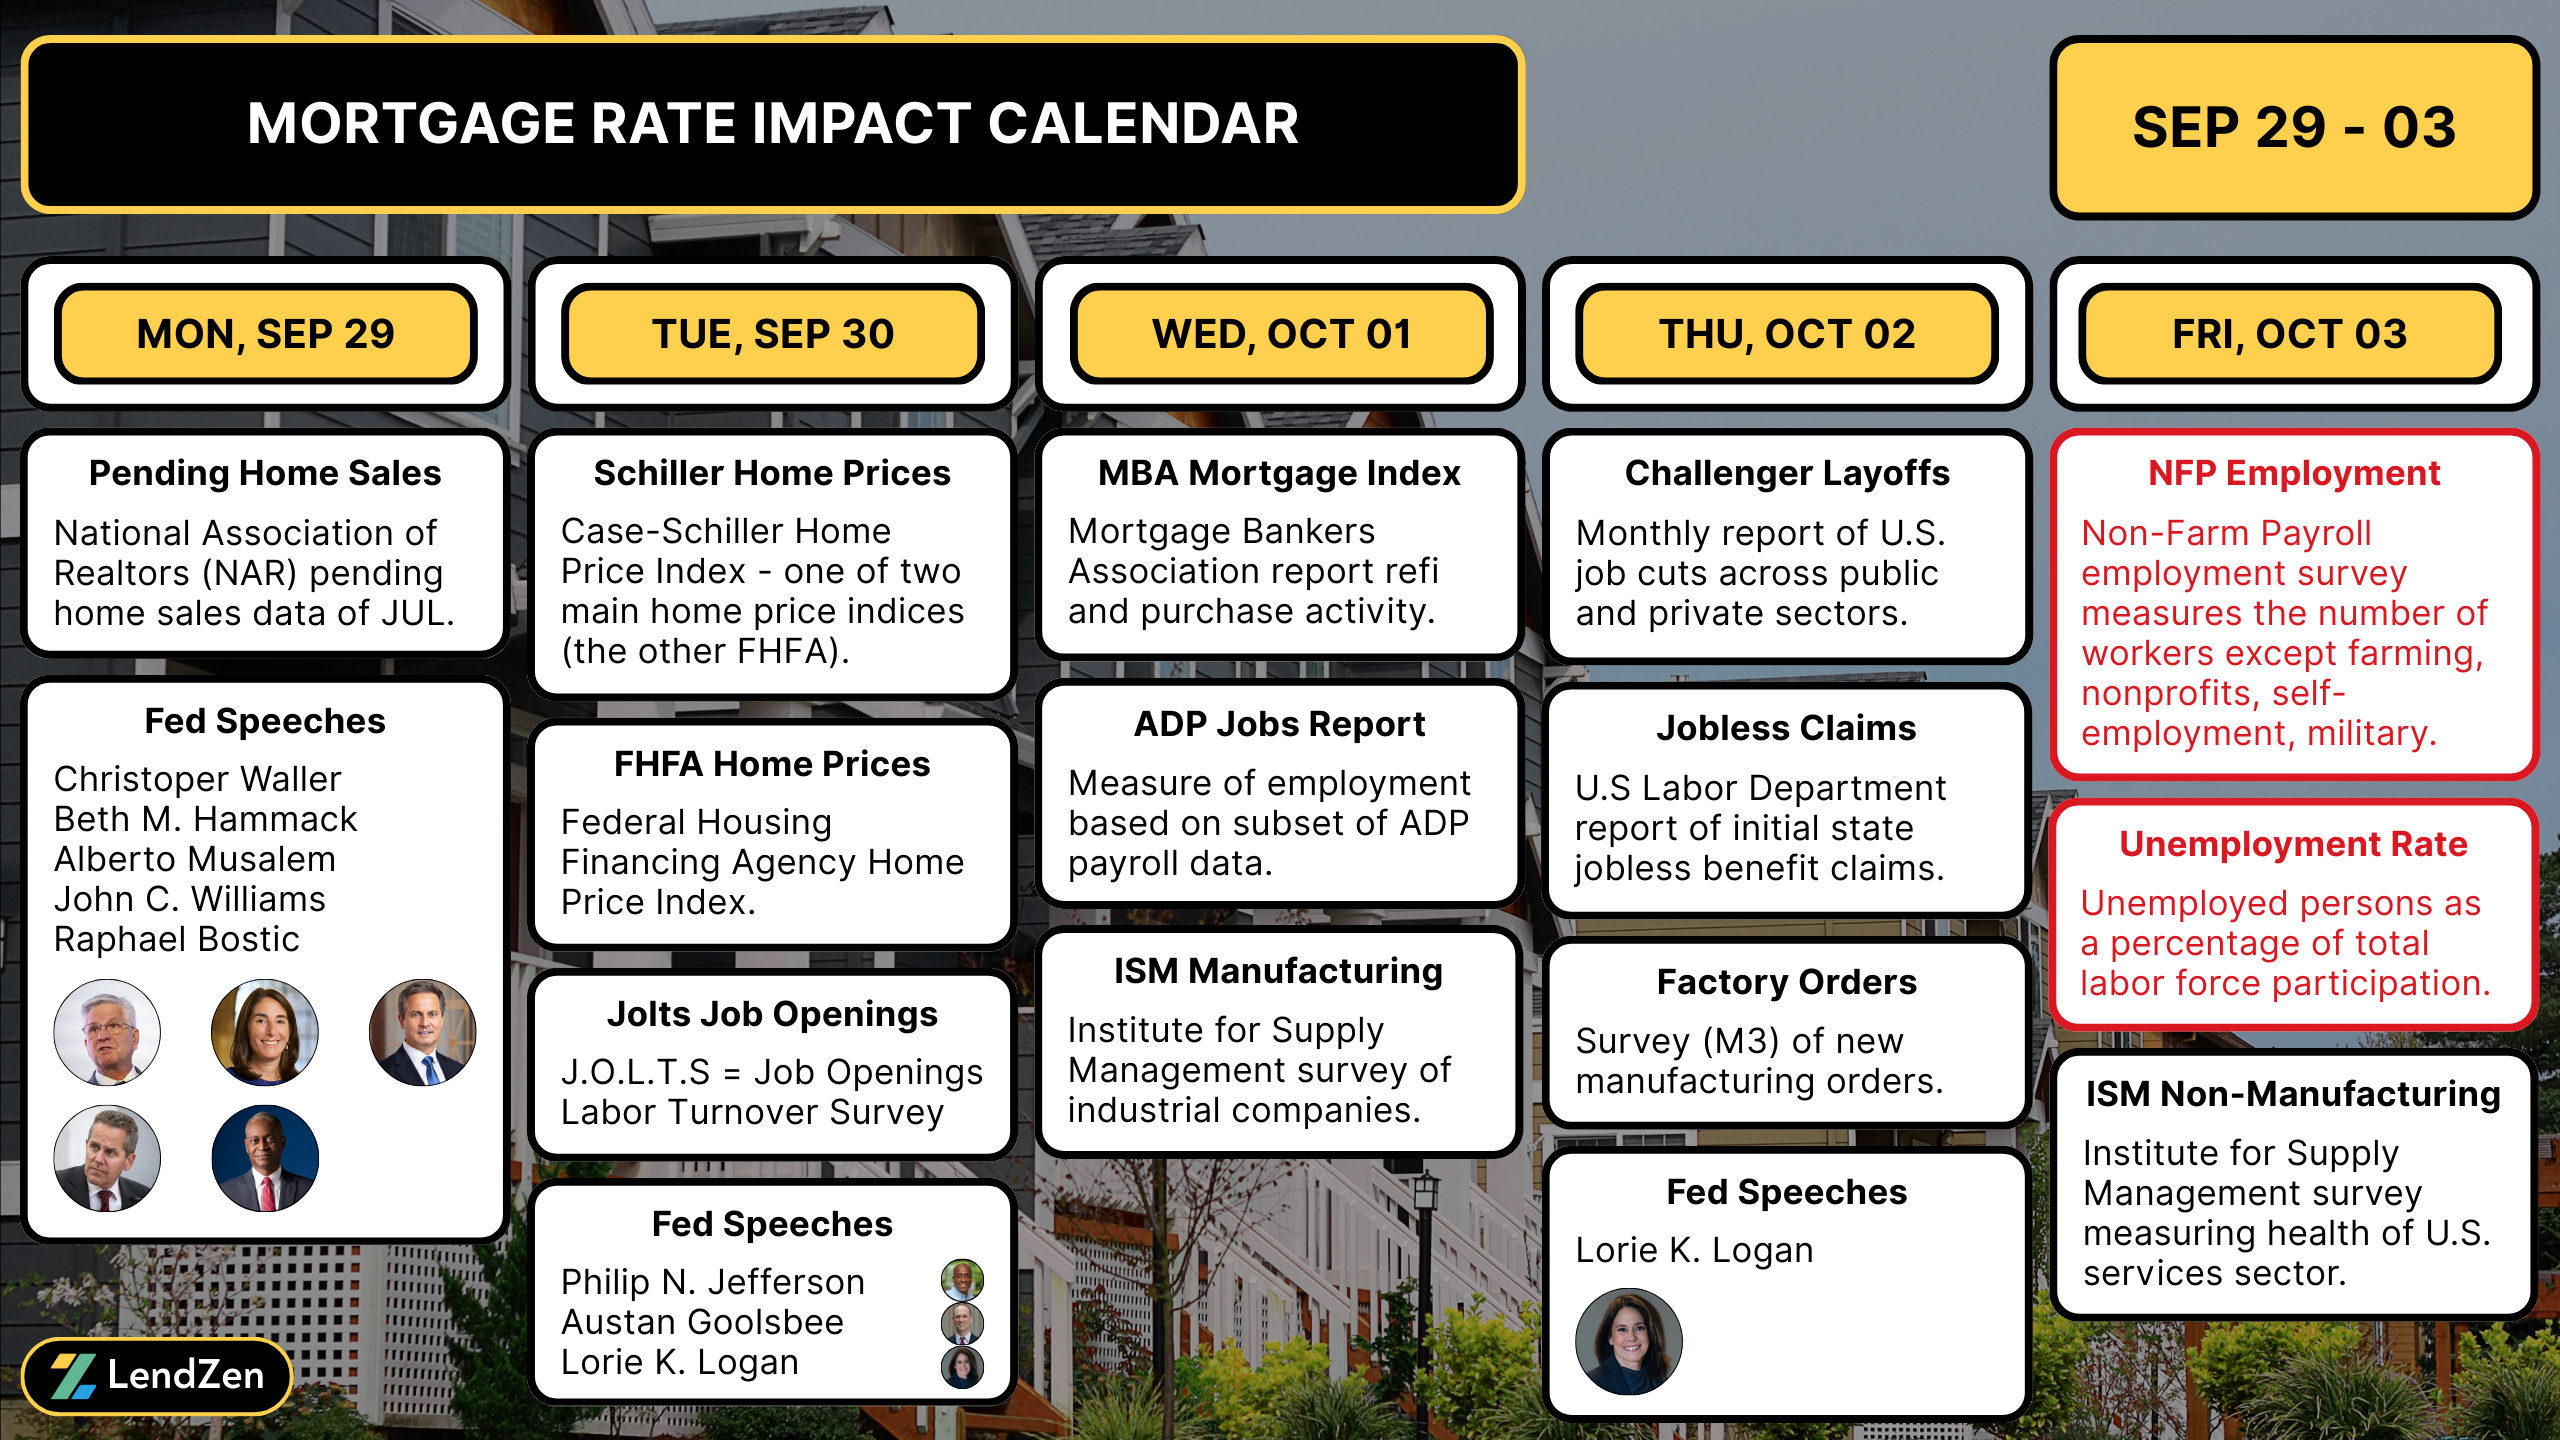
Mortgage Rate Data Deluge - SEP 29
Here is a deluge of mortgage rate data to start your week!

MARKET RECAP 📉
------------------
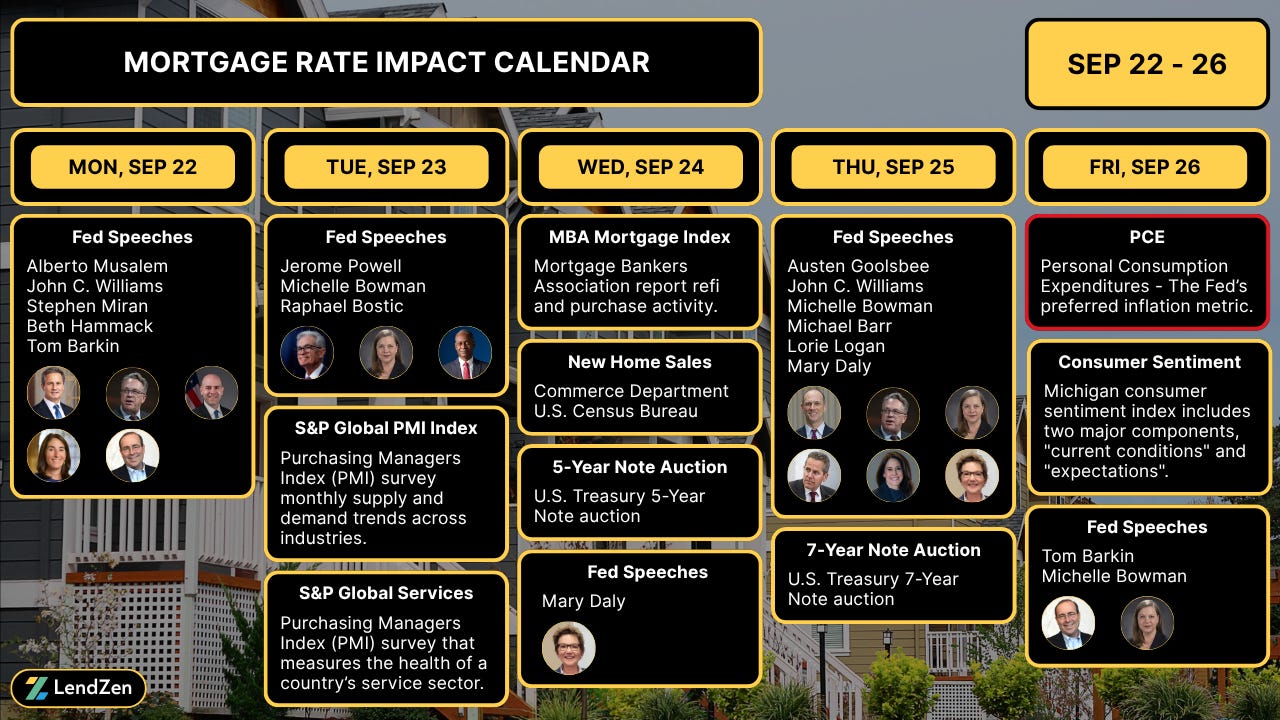
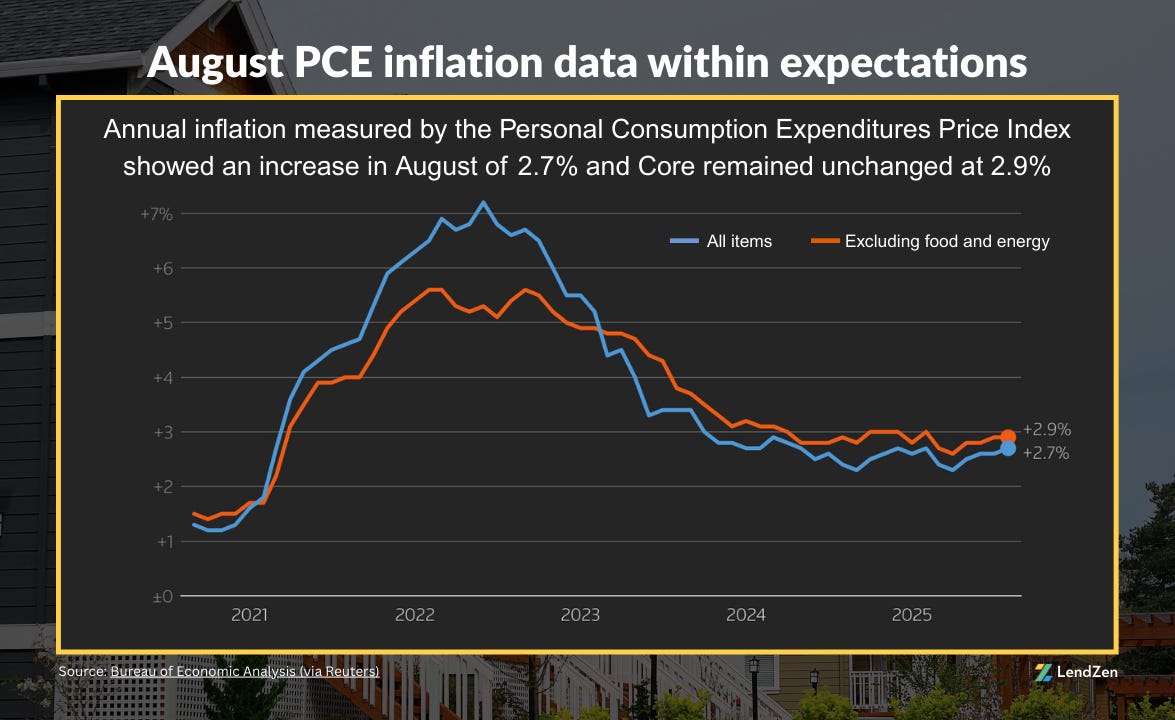
In addition to a plethora of Fed speeches, last week’s biggest “potential” market mover was the Fed’s preferred inflation report, Personal Consumption Expenditures (PCE).
The PCE Price Index advanced 2.7% since last August.
Meanwhile, the Core PCE, which excludes the volatile food and energy components, met expectations at 2.9%.
Both components were up 0.2% month-over-month.
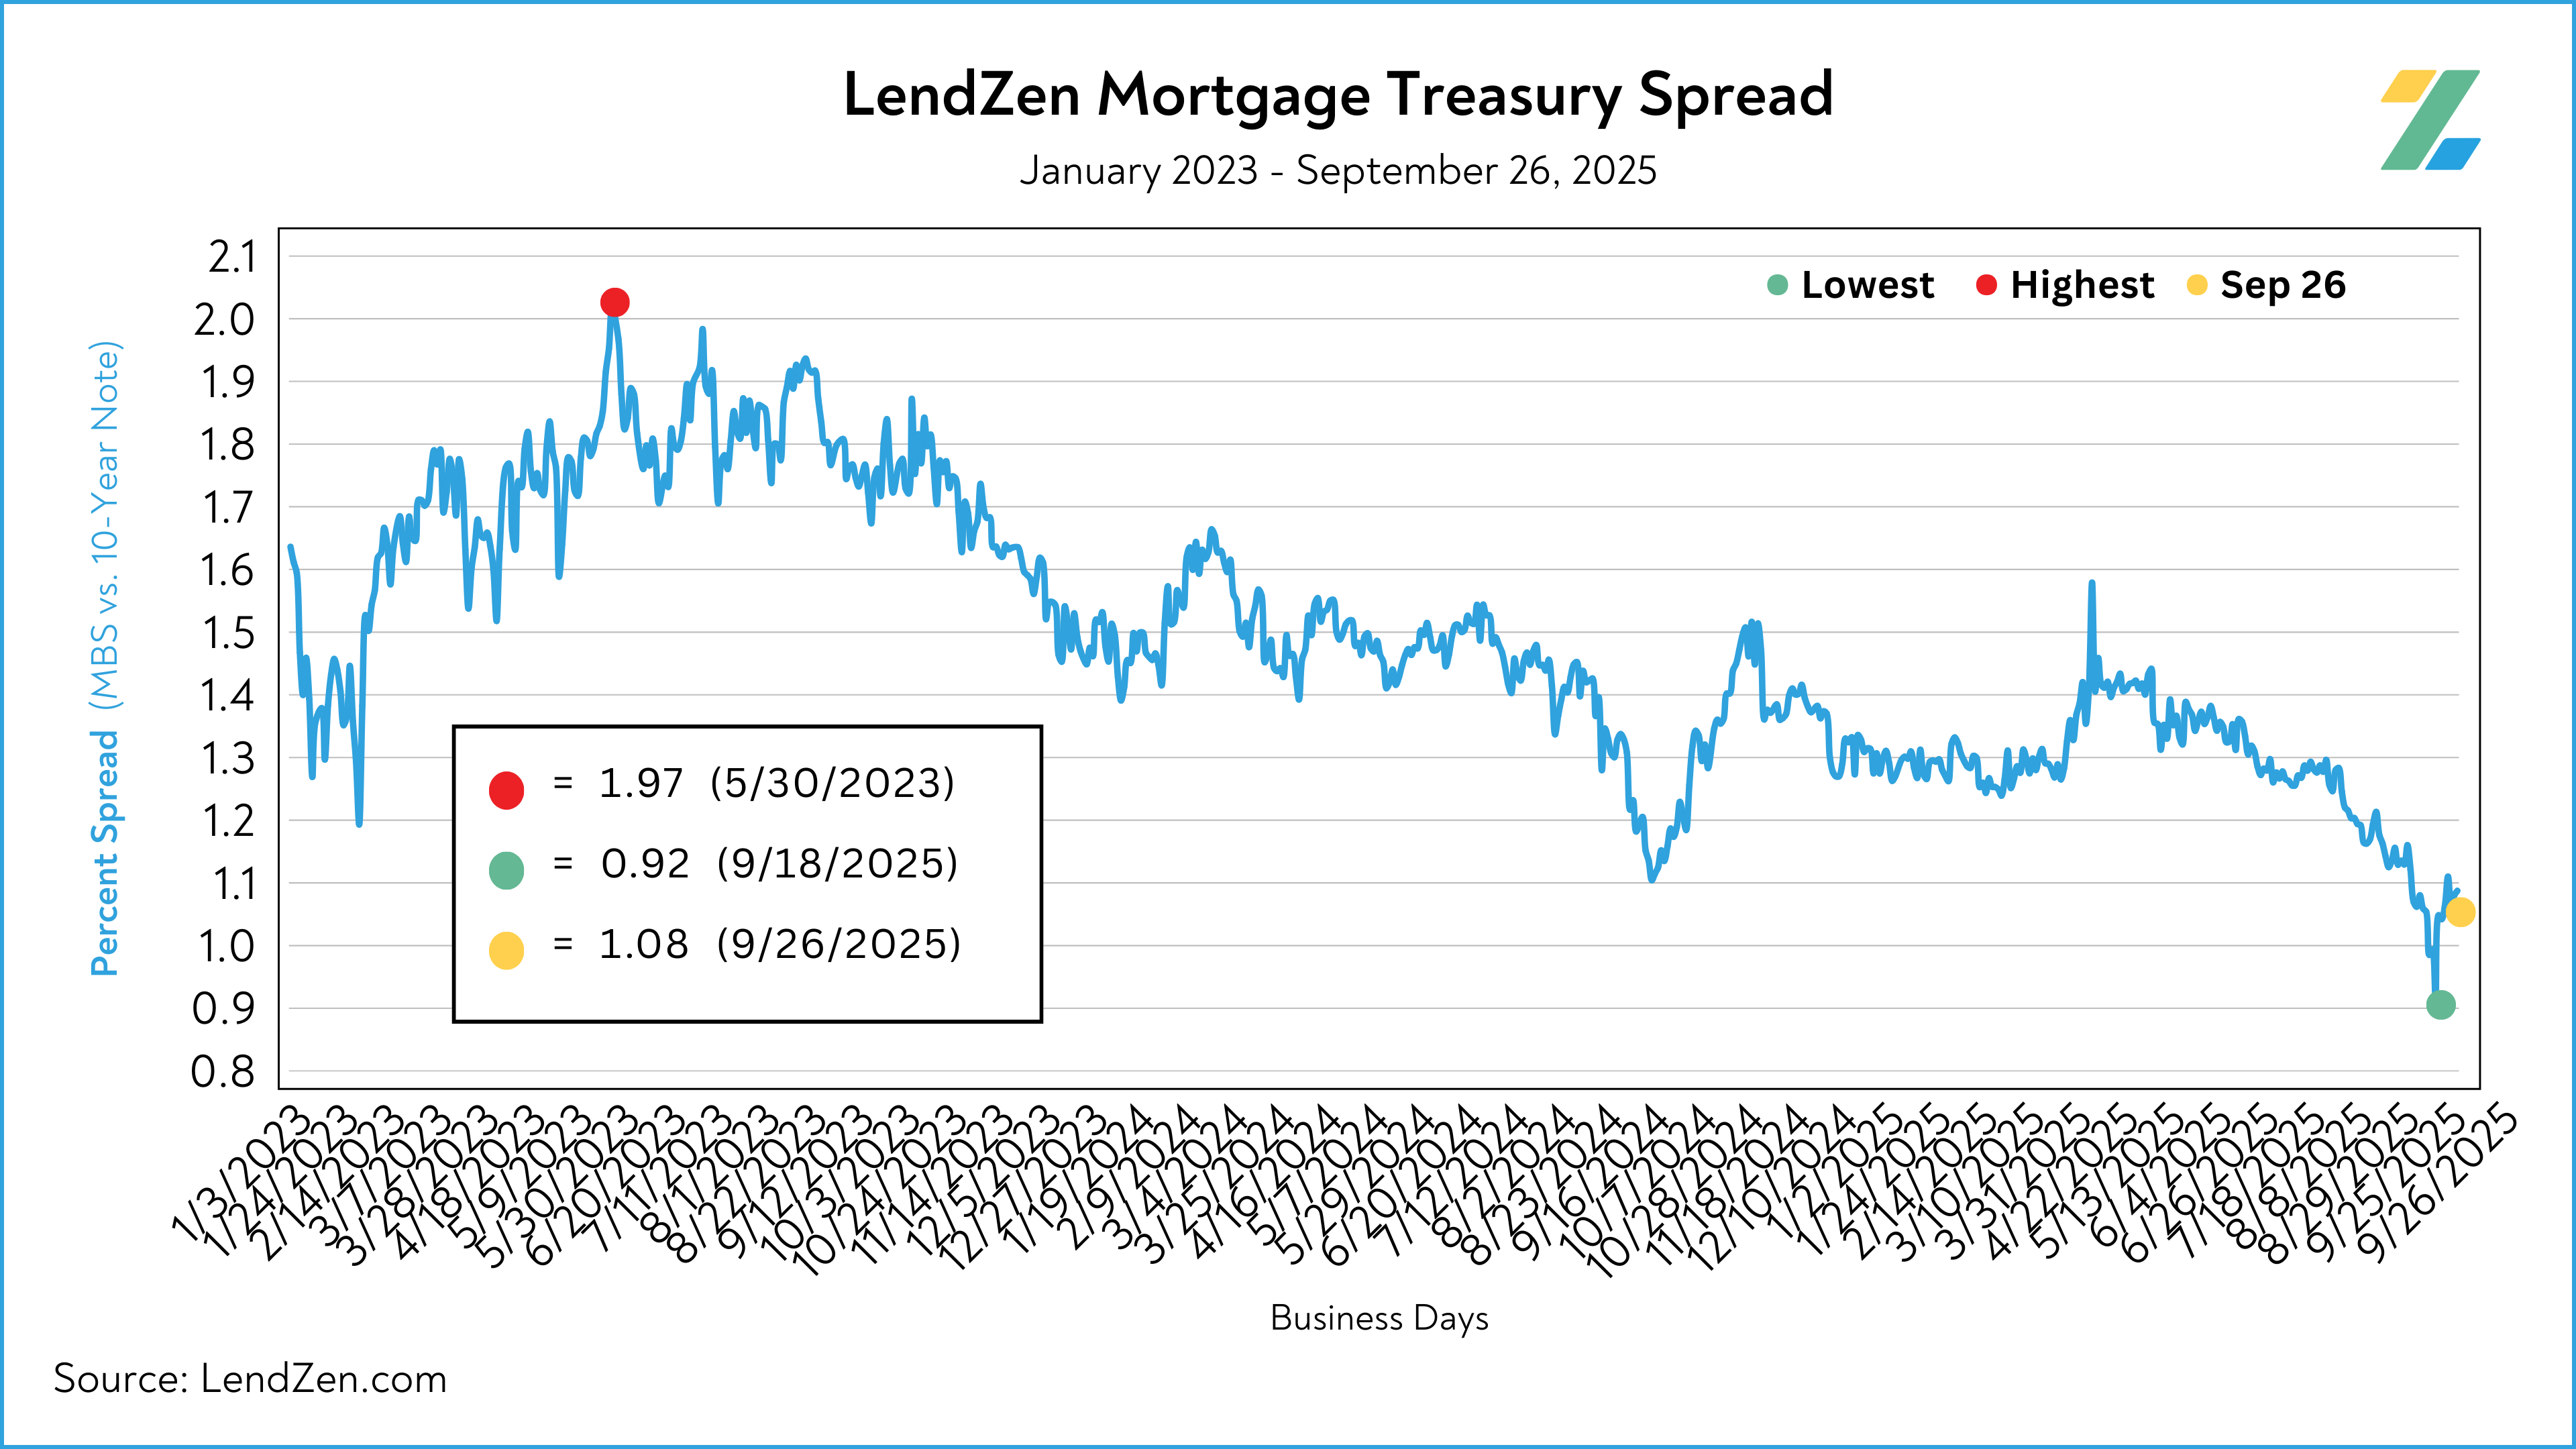
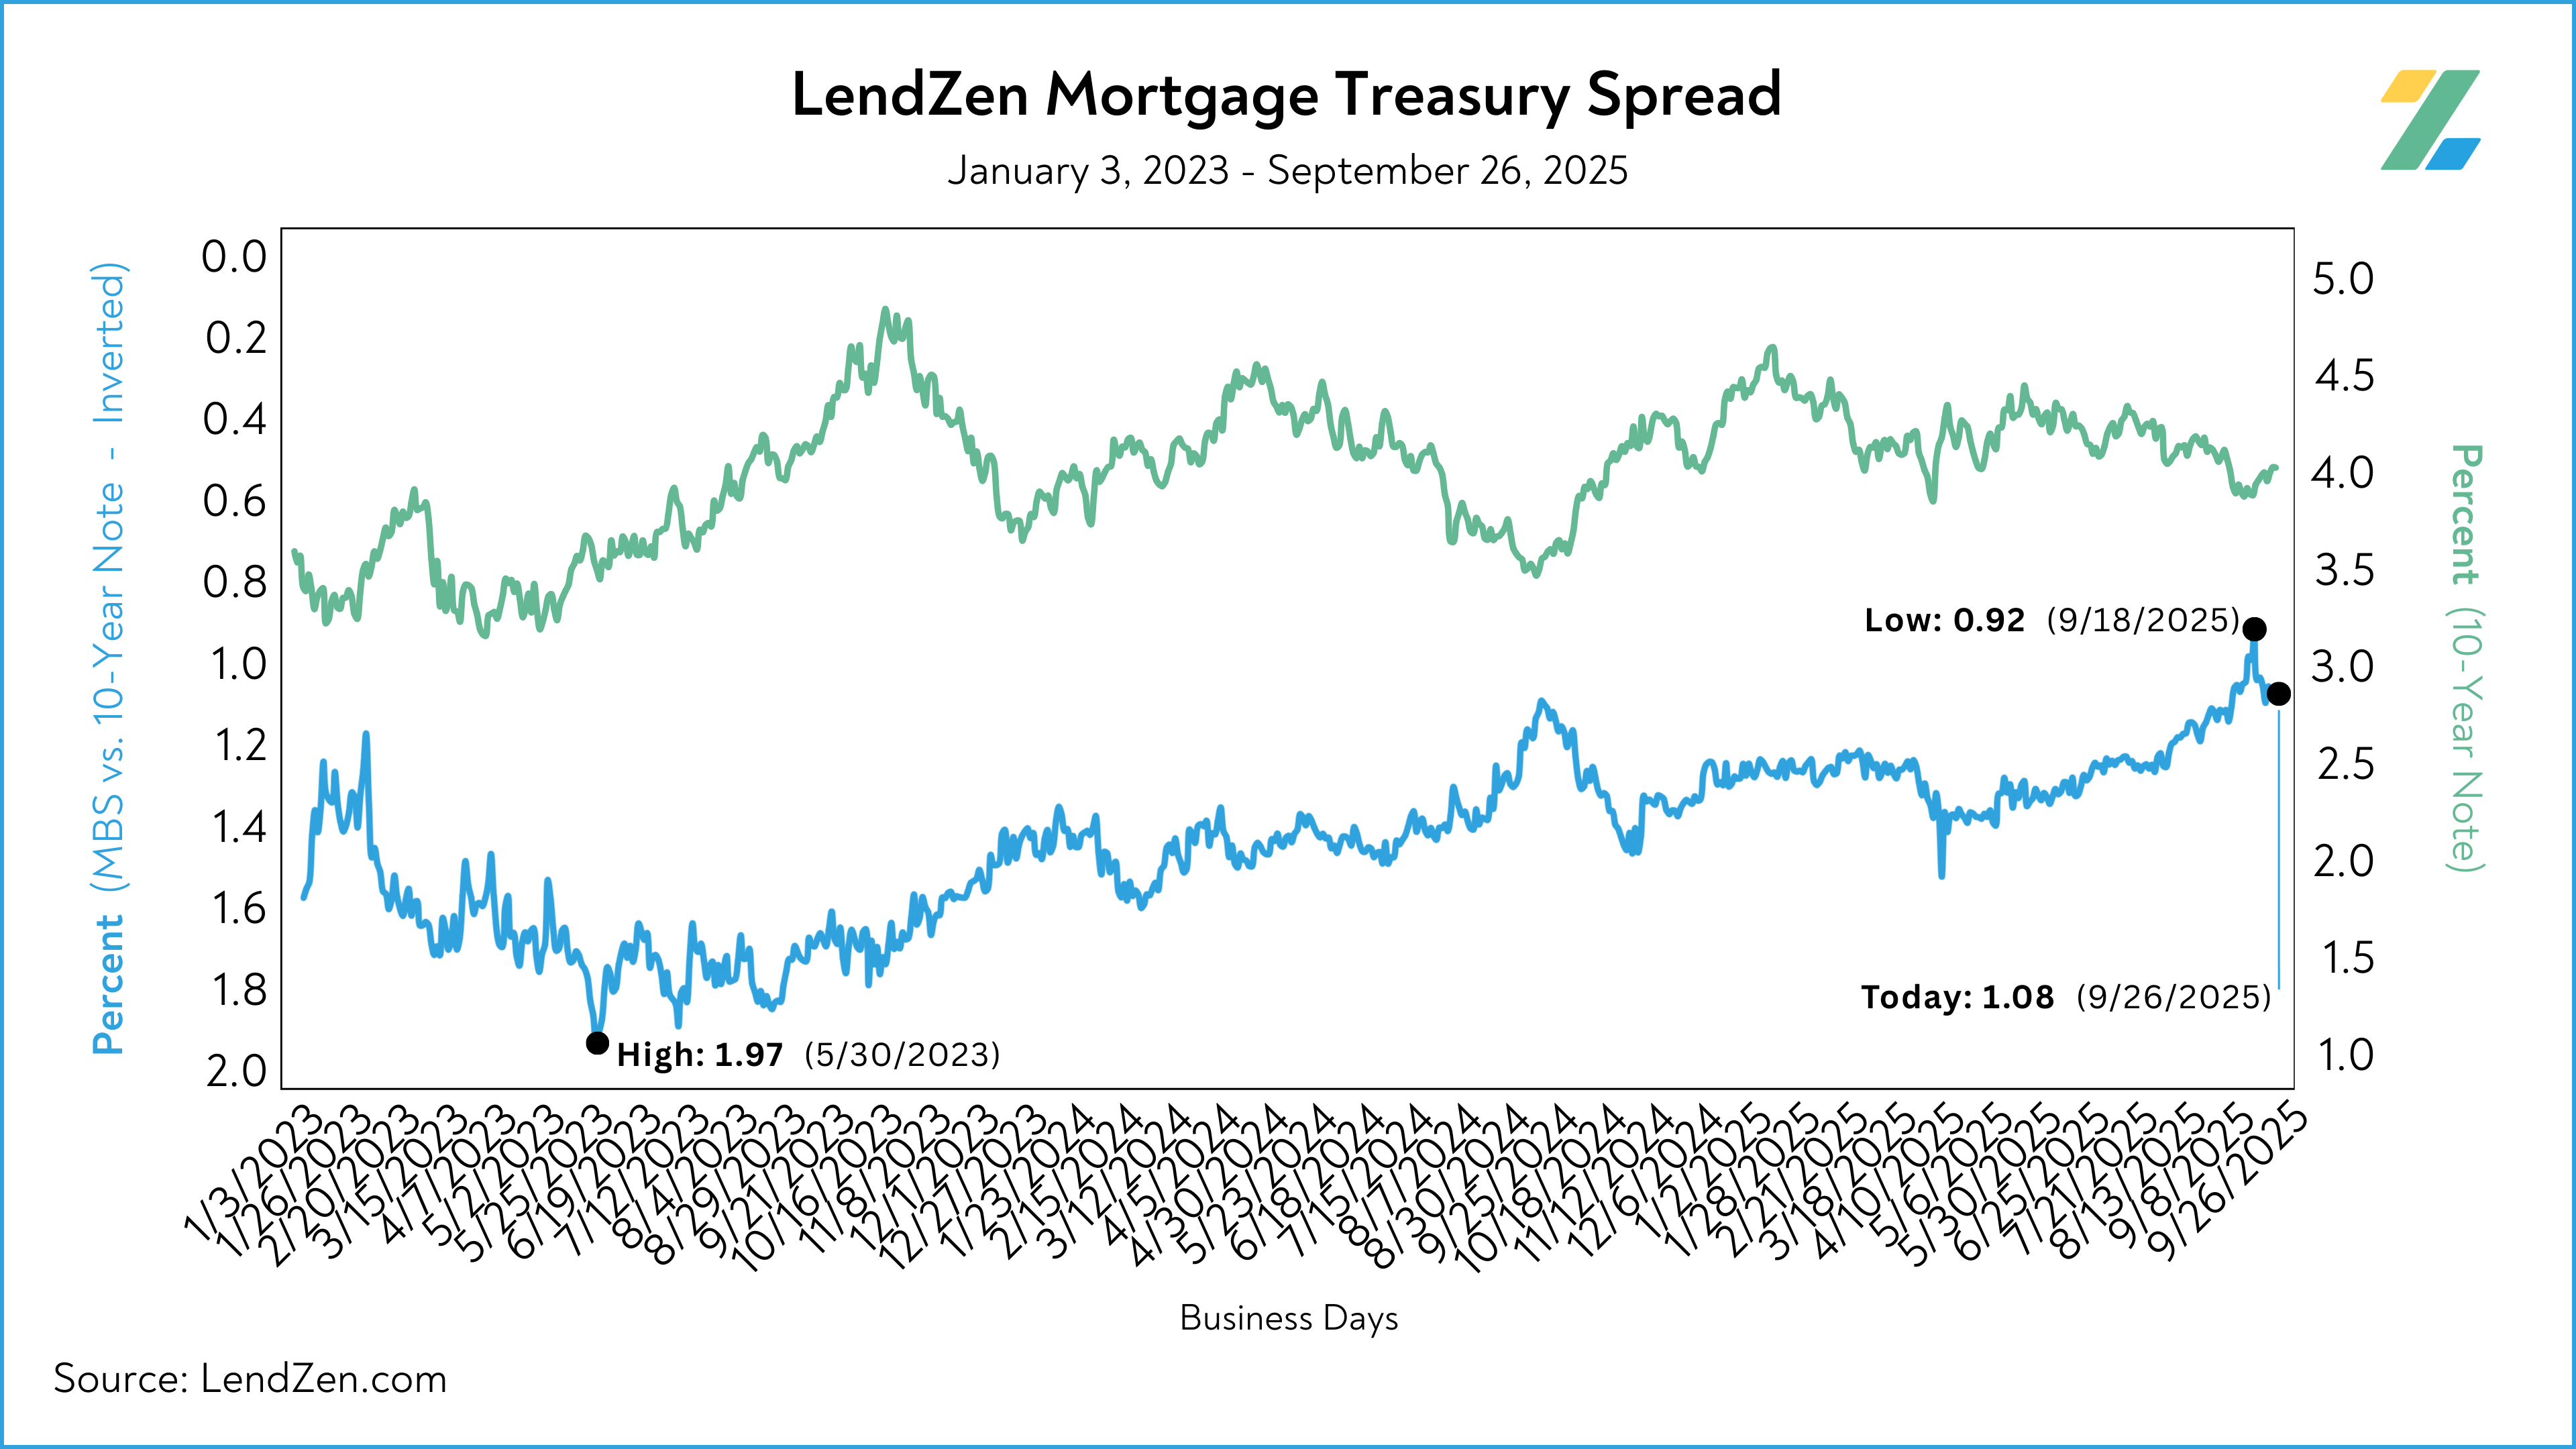
MORTGAGE SPREADS 🧈
-------------------------
The spread between mortgage bonds and the 10-Year Note held steady overall last week, with both trading flat on Friday.
LMTS 9/25 = 1.08
LMTS 9/26 = 1.08 ➡️
The LendZen Mortgage-Treasury Spread uses actual bond yields to create a historically consistent, and reliable, data set.
Learn more on this Substack post.
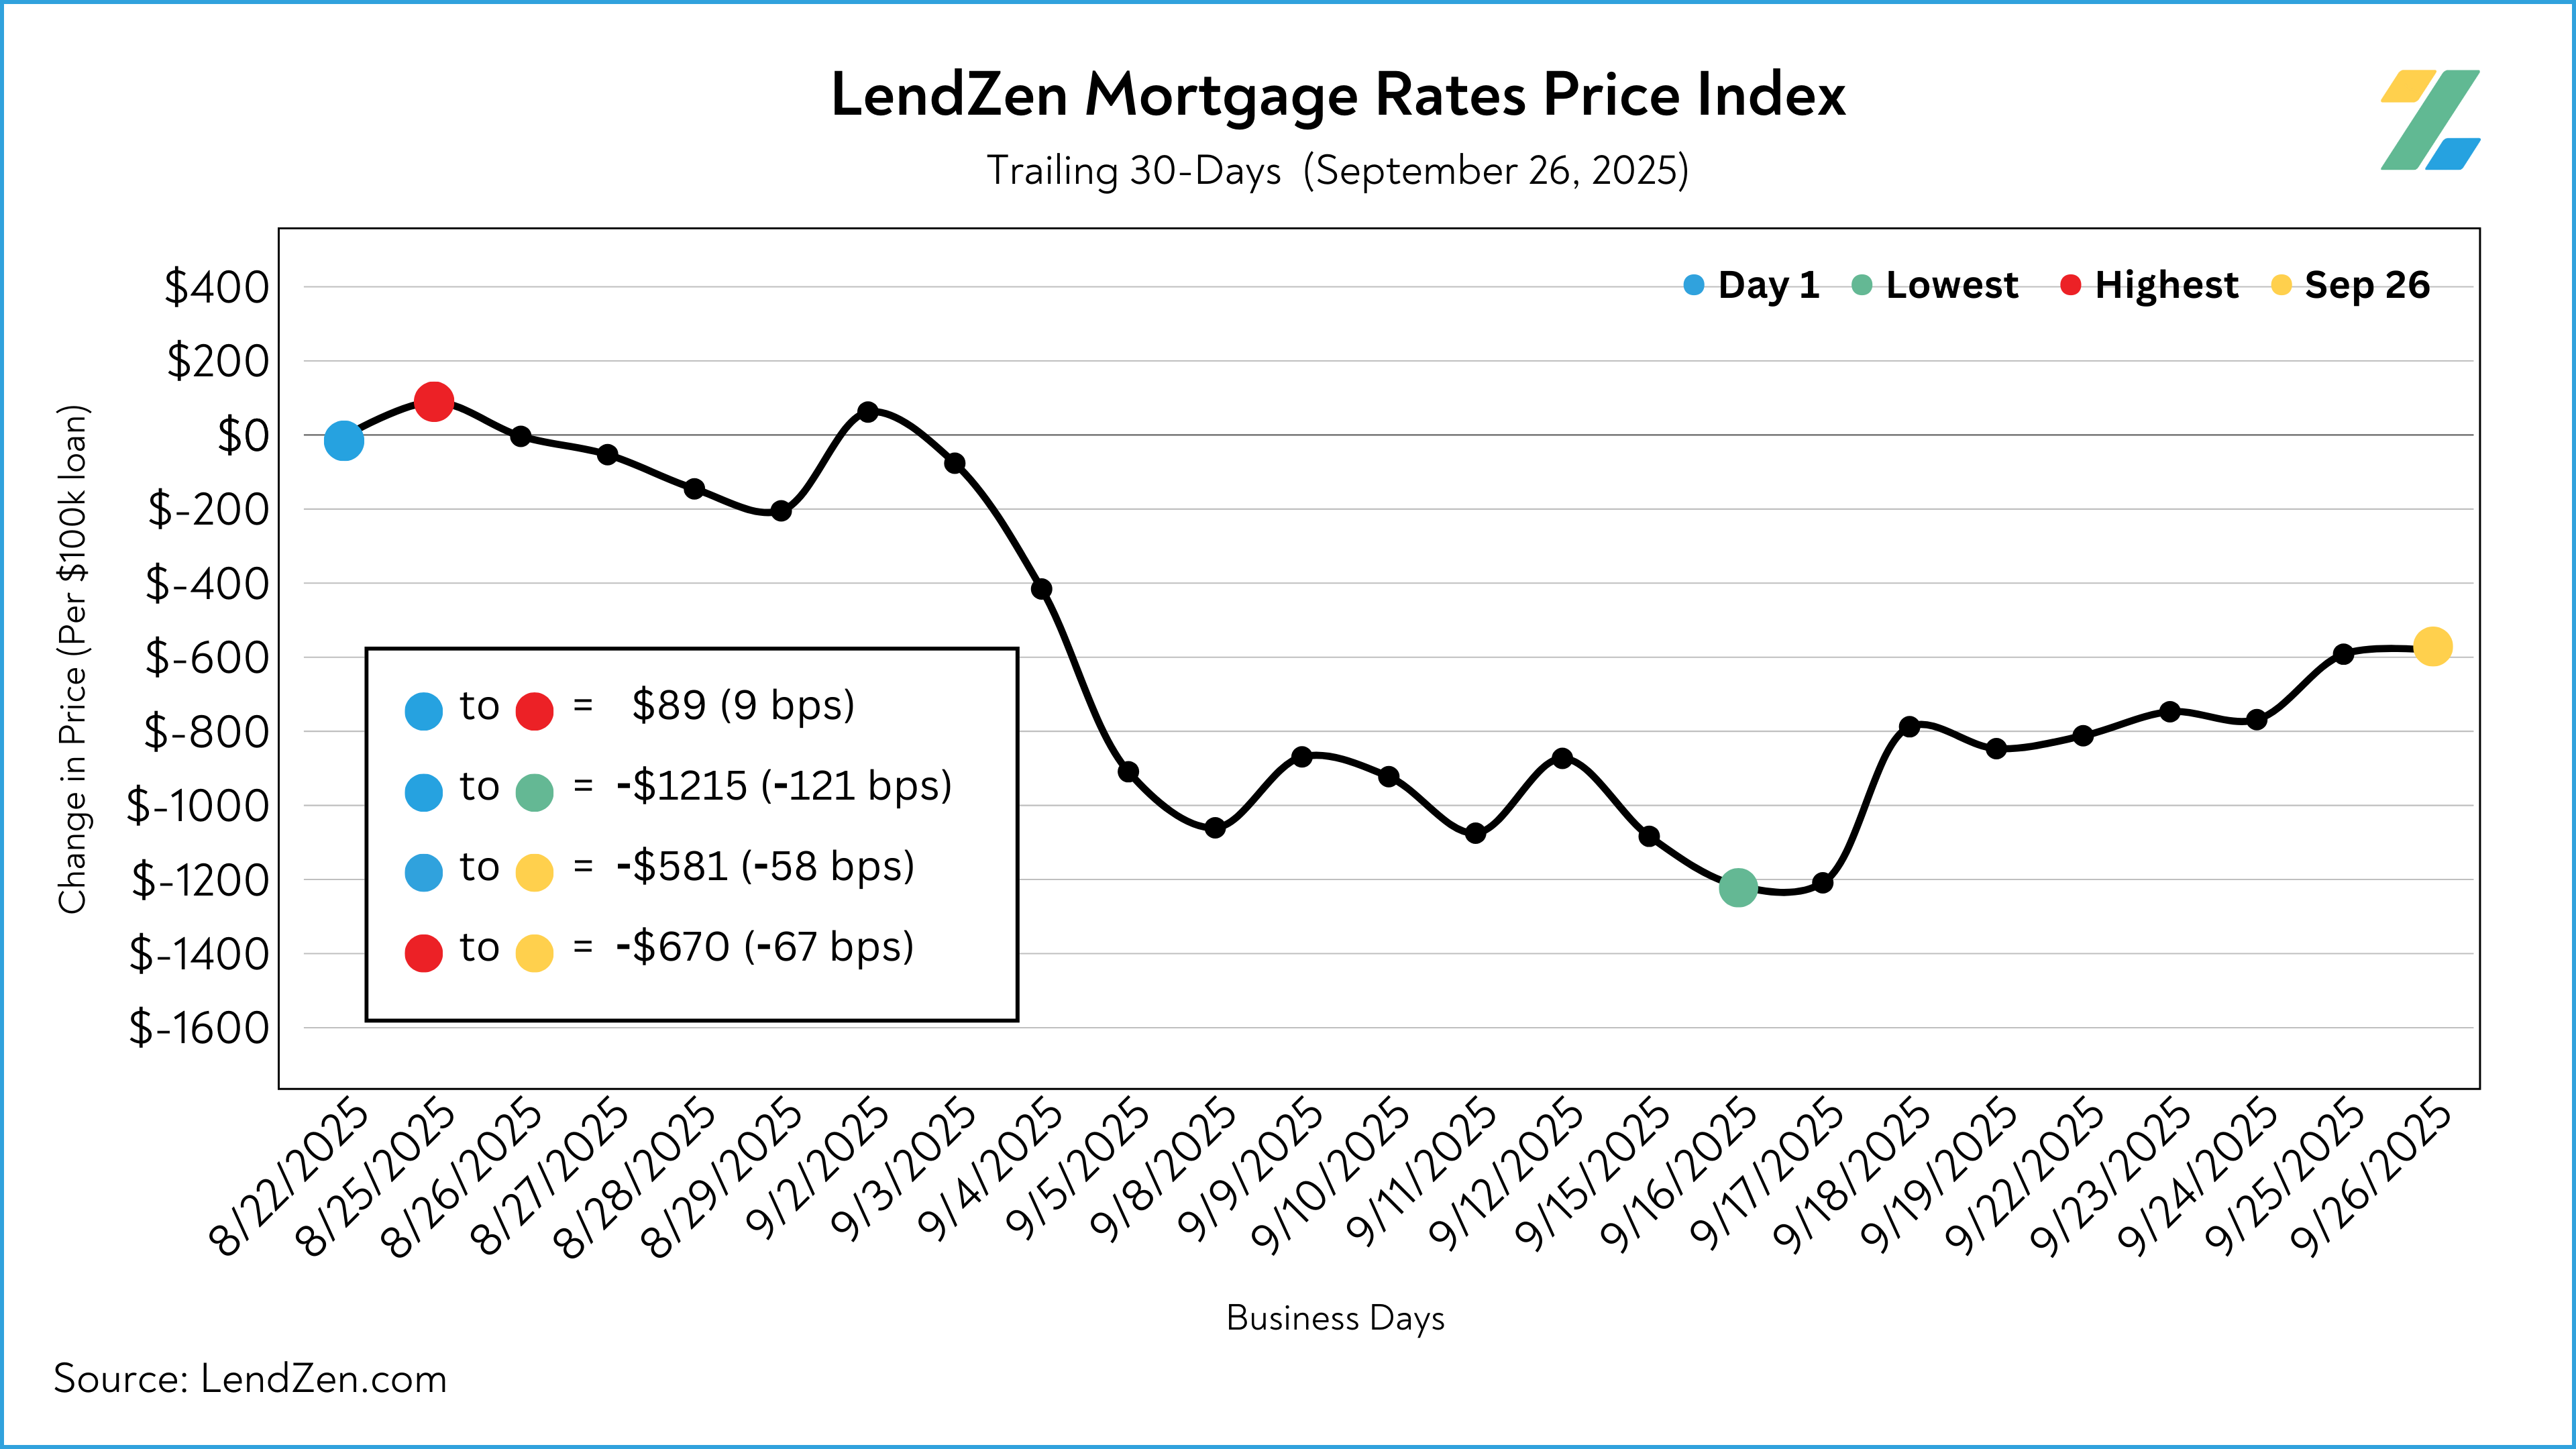
MORTGAGE RATE PRICES 📉
-----------------------------
Mortgage rates do not rise or fall, instead the PRICE of rates change.
The LendZen Index calculates a daily change in the price of mortgage rates by tracking a spectrum of mortgage-backed securities (MBS).
This provides borrowers with a more specific measurement of how the cost to obtain a mortgage is changing, regardless of the lender, rate, or credit score.
-----------
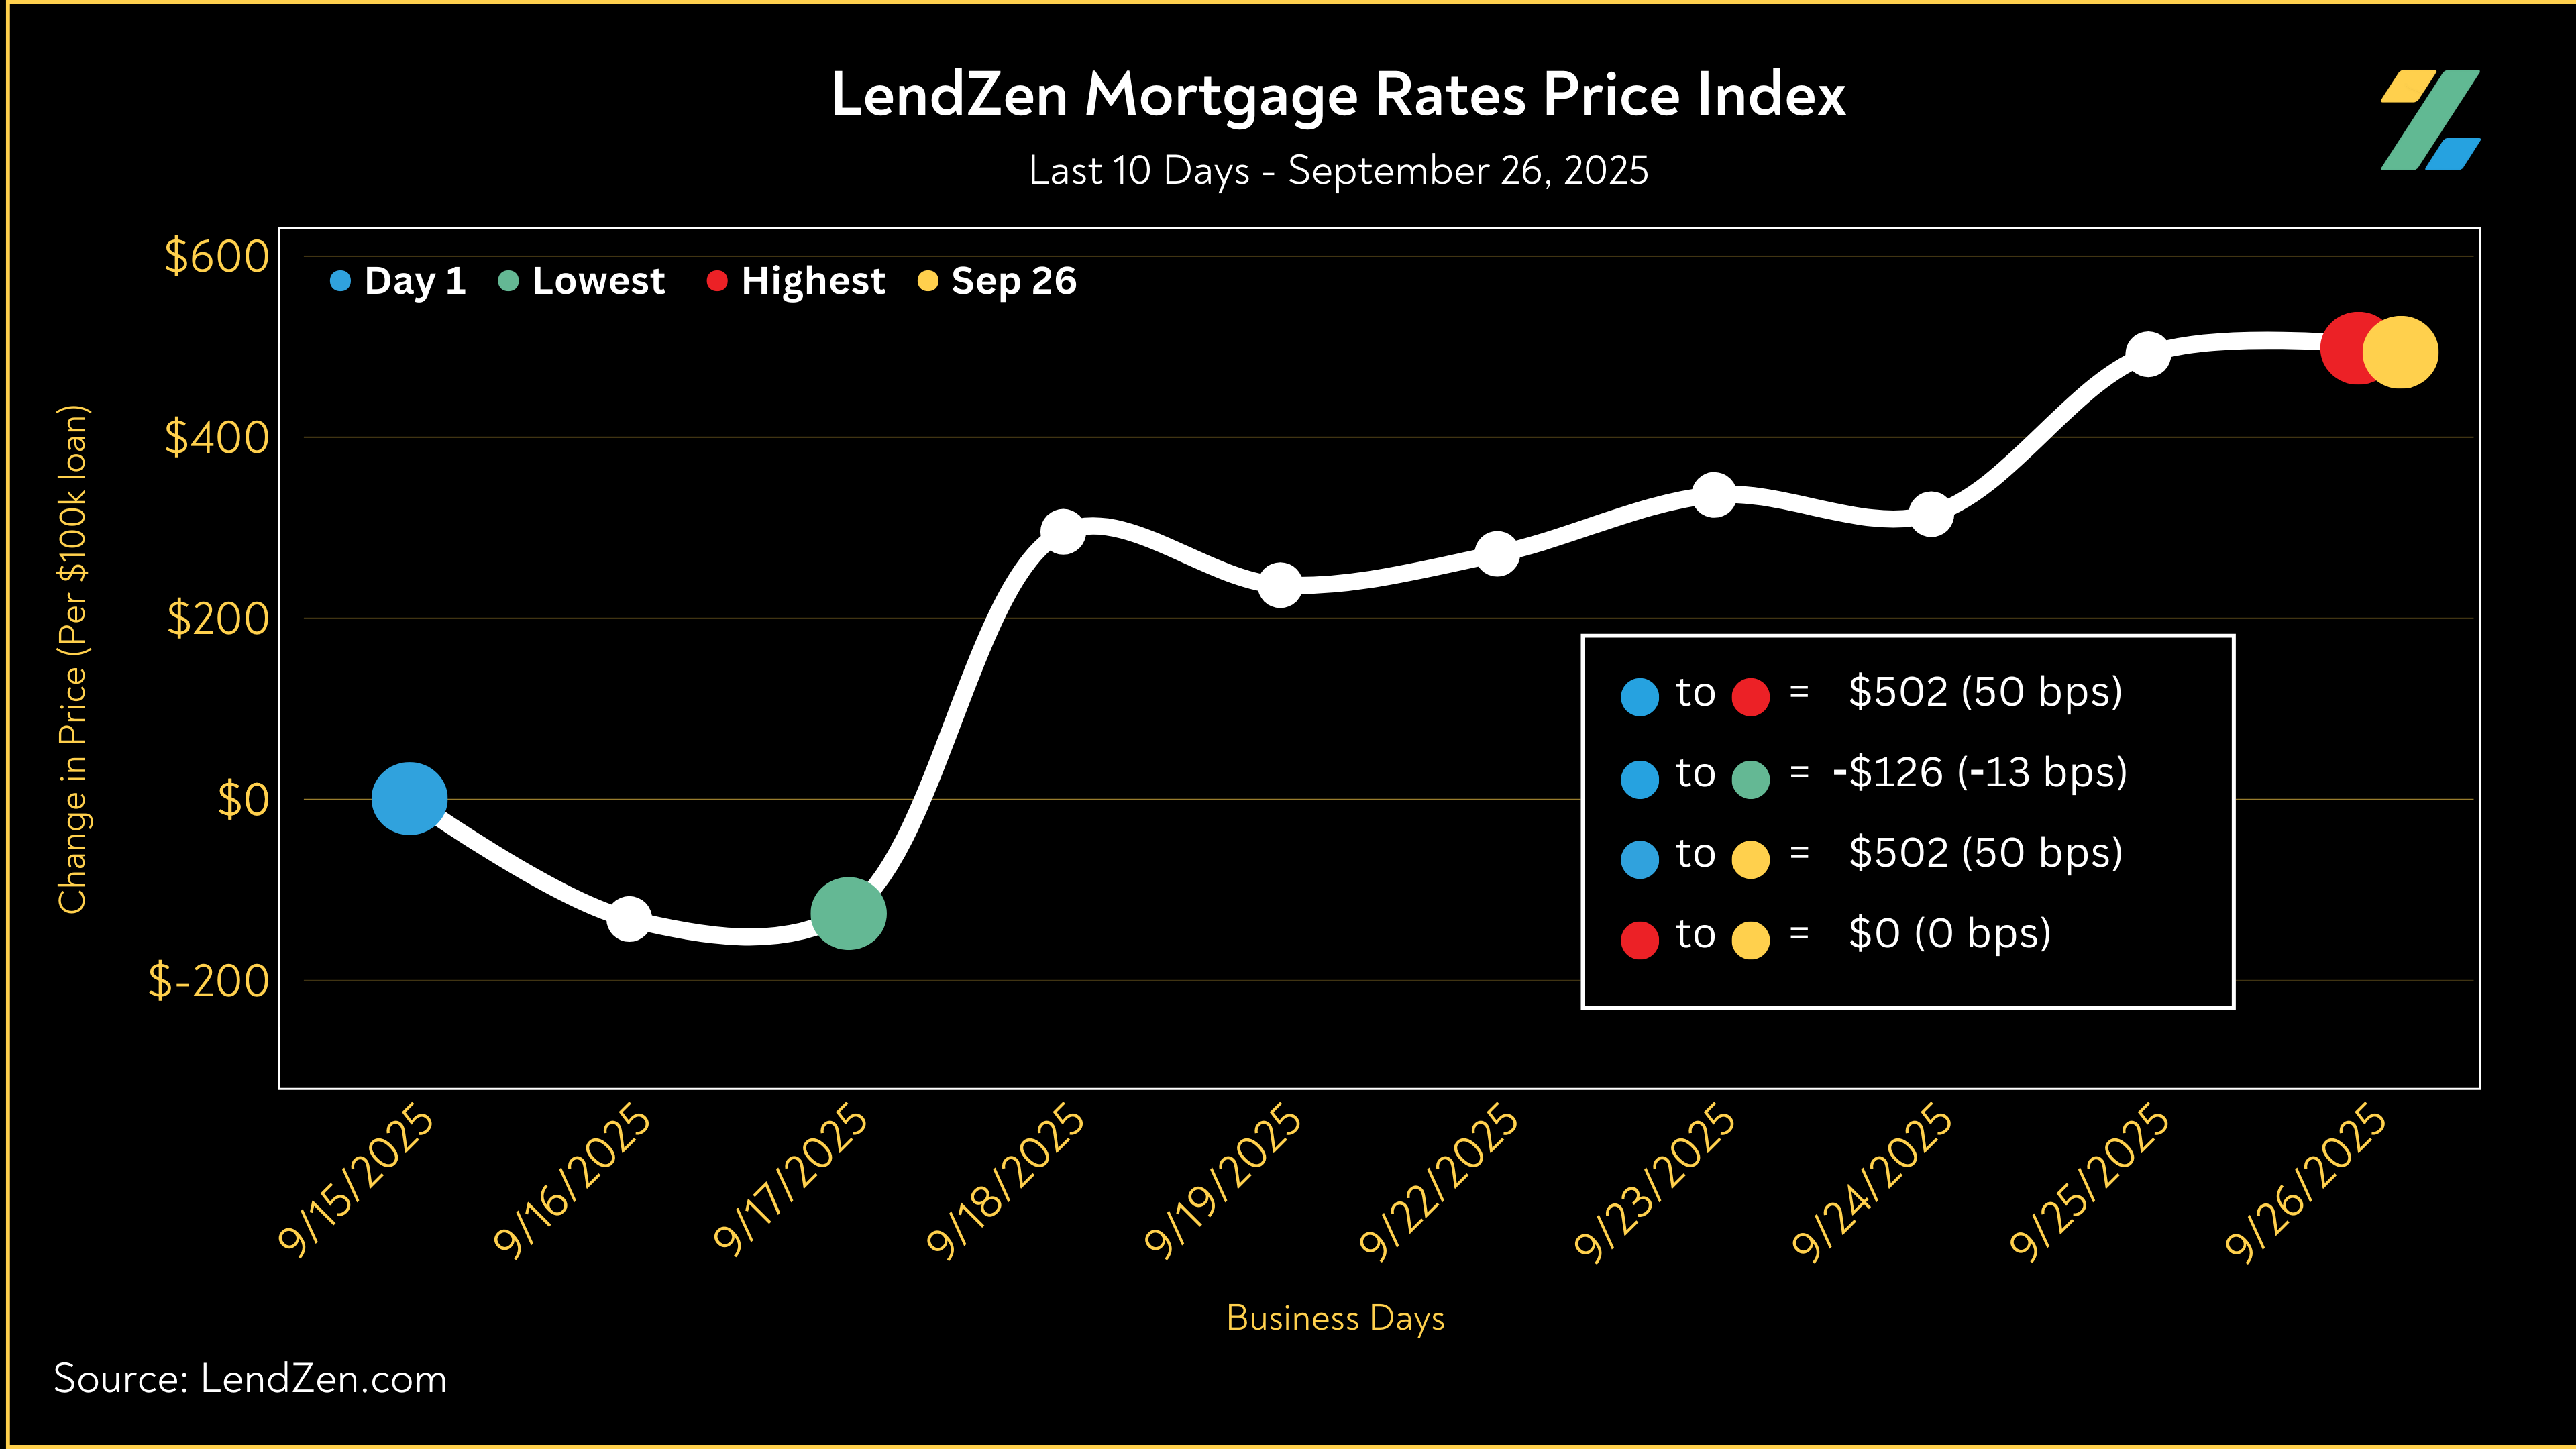
9/26/2025
-----------
24-Hour: +1 bps ($10 per $100K)
5-Day: +23 bps ($231)
10-Day: +50 bps ($502)
30-Day: -58 bps (-$581 less expensive per $100K)
Since July 1: -104 bps (-$1043)
Mortgage rate prices declined nearly 200 basis points since the July 15 high.
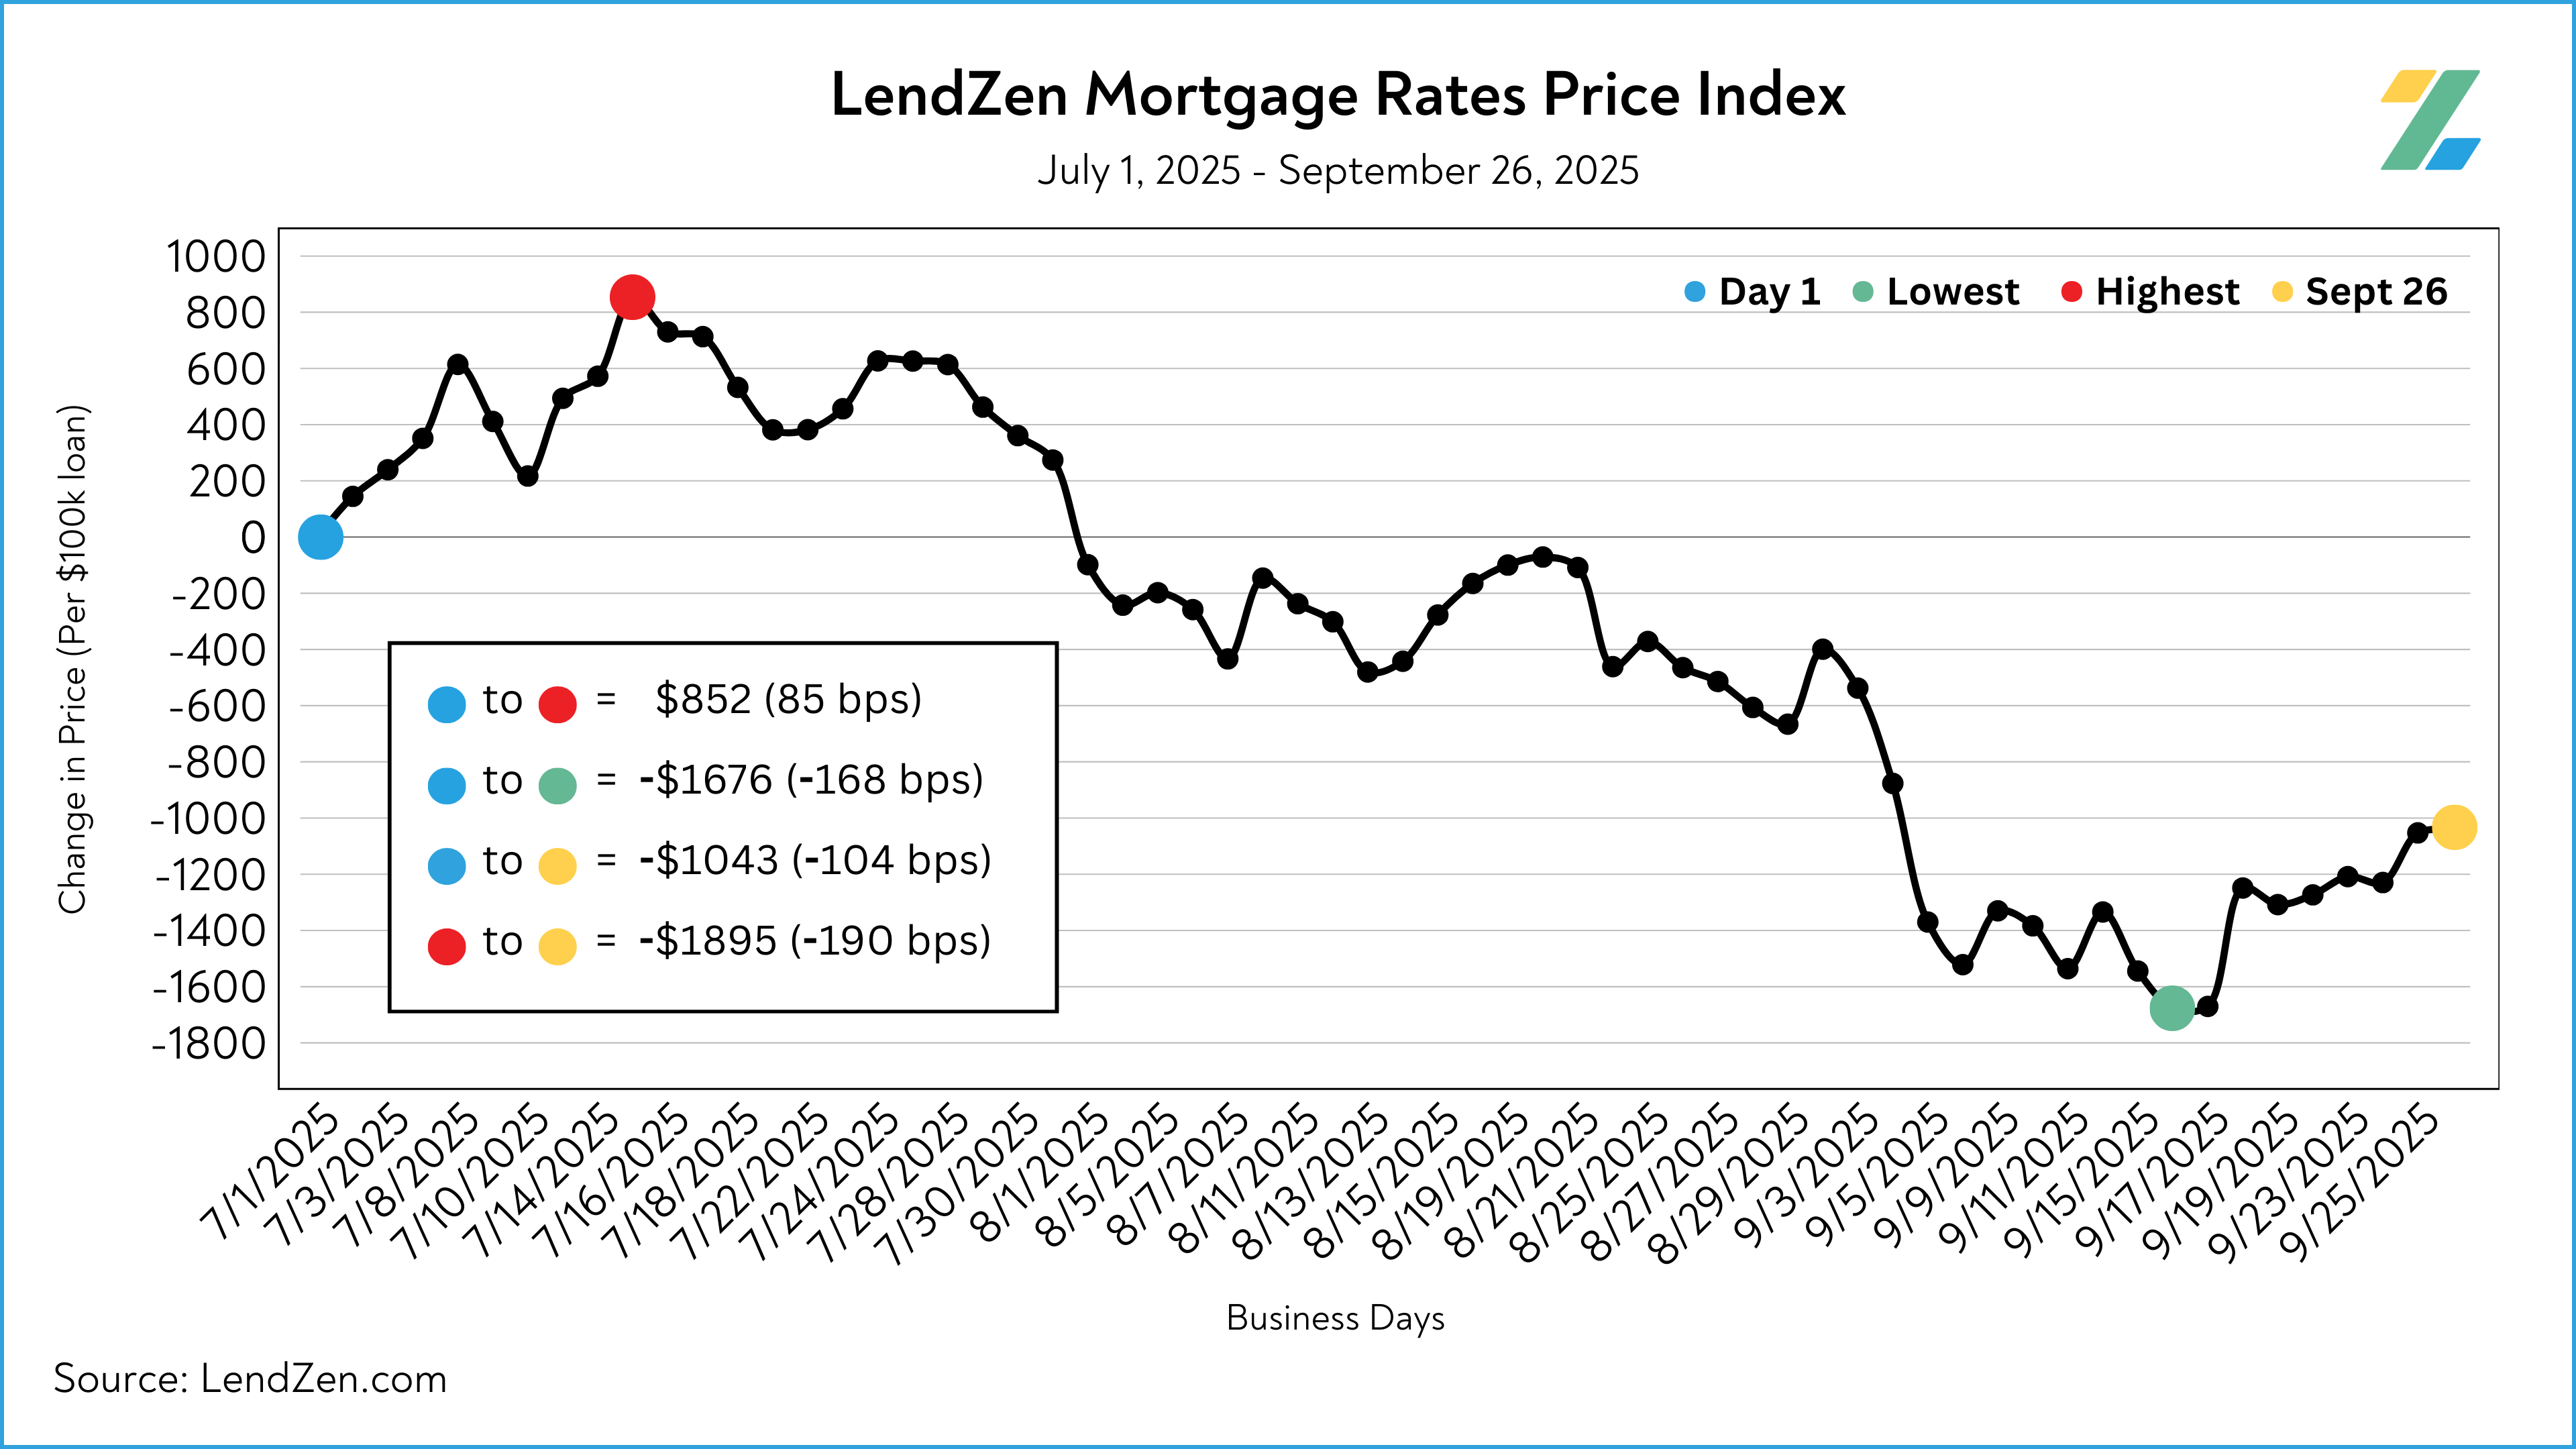
Unfortunately, we have given back 50 bps since the Fed rate cut.
The 30-Day trend is still positive with the cost to obtain a $500K mortgage down $2,900 (-58 bps) from a month ago.
The Non-Farm Payroll employment report and unemployment rate will be released Friday.
Last month’s NFP was the main contributor behind August’s nearly 200 bps rate price decline; let’s hope for a repeat.
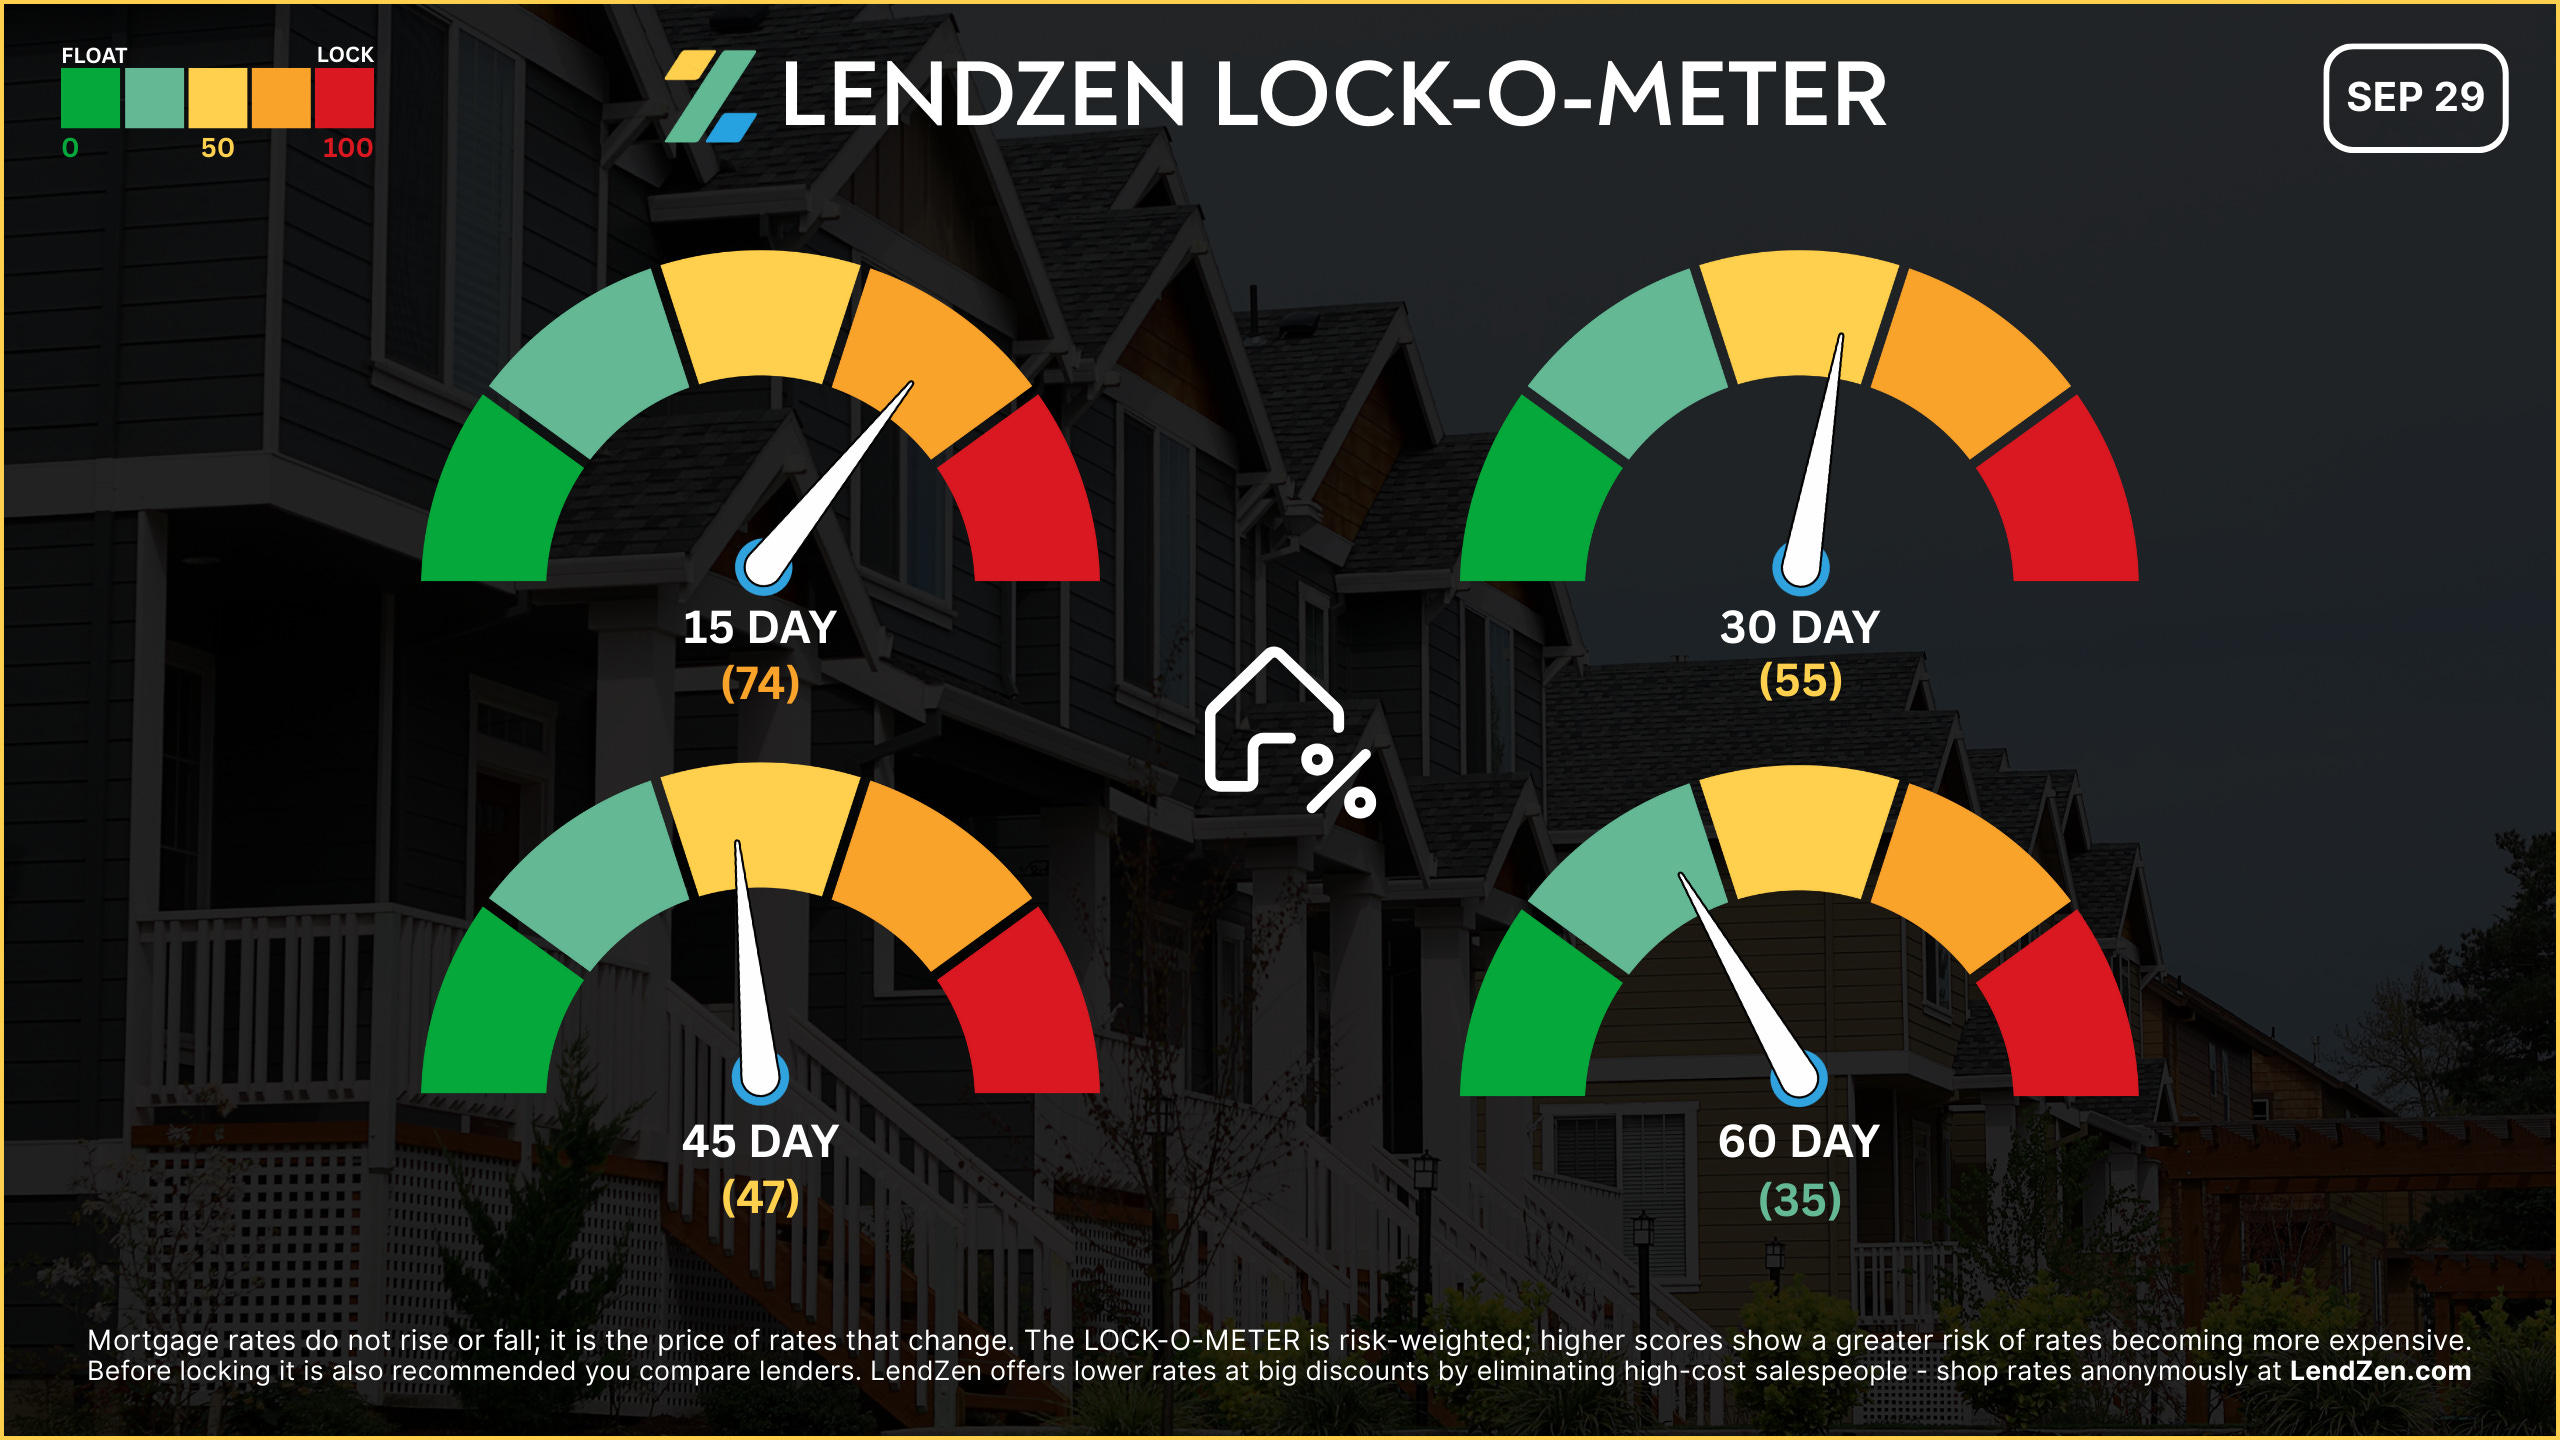
RATE LOCK GUIDE 🔒
---------------------
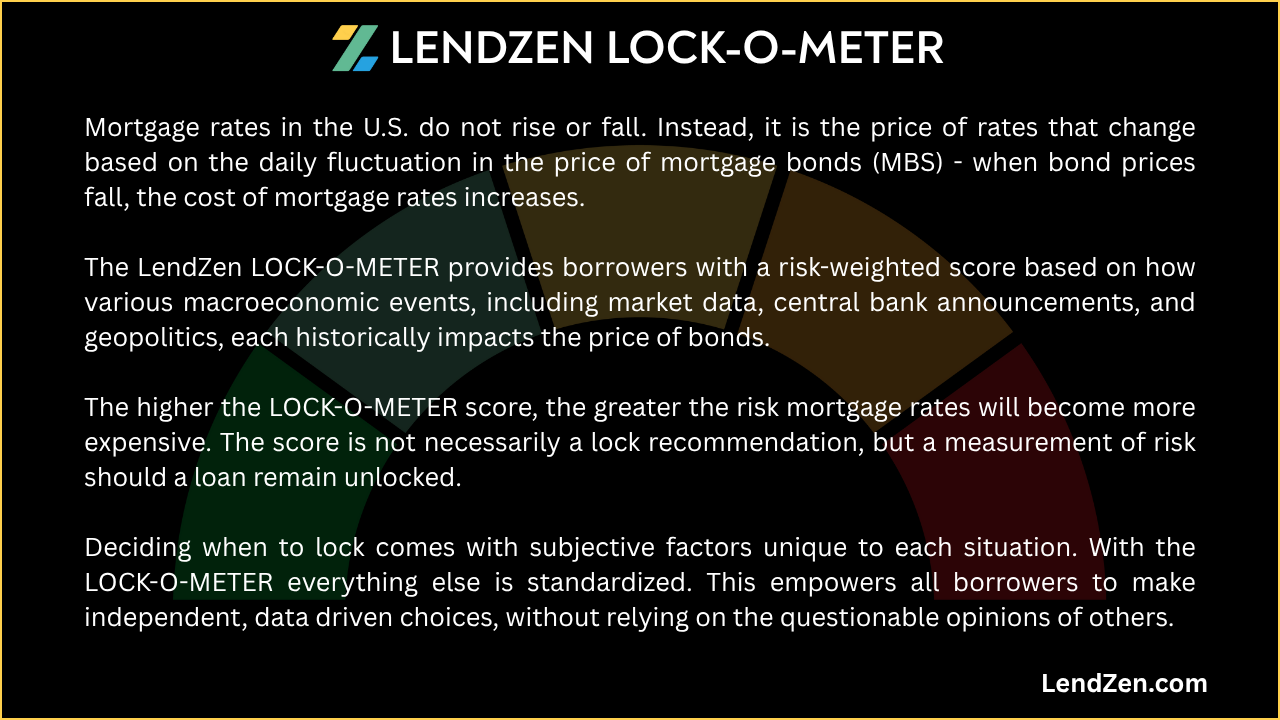
The LendZen LOCK-O-METER provides borrowers with a risk-weighted score based on how various macroeconomic events, including market data, central bank announcements, and geopolitics, each historically impacts the price of bonds.
higher risk scores = lean towards locking
-------------------
Closing Window
--------------------
[ 15 Days ] -- 74 🔴
Labor data + CPI within 15 days = high-risk window; dicey to float near-term.
[ 30 Days ] -- 55 🟠
NFP + CPI + FOMC minutes = volatile stretch. Only float if you have tolerance for chop.
[ 45 Days ] -- 47 🟡
Risk moderates slightly; post-CPI clarity could allow some float breathing room.
[ 60 Days ] -- 35 🟢
If inflation stays tame, October/November could bring relief.