
Mortgage Rate Data Deluge – OCT 20 🏠📉🔒
Here is a deluge of mortgage rate data to start your week!

KEY TAKEAWAYS ✅
------------------
CPI on Friday is the fulcrum:
A soft print could unlock a fresh round of pricing improvements and reinforce long-end bond buying. But a hot reading could send bonds running, and mortgage rates back to retest the September highs.
Gold as a wild card:
If the “pet rock” continues to act as the preferred risk-off hedge, it further undermines the role of Treasuries during volatility, weakening the potential for mortgage rates to improve.
Upcoming events:
PCE (next week) and NFP (backlog) will help confirm if the disinflation trend is real or just noise, which will guide markets to reprice accordingly ahead of the next Fed rate decision (Oct 28-29).
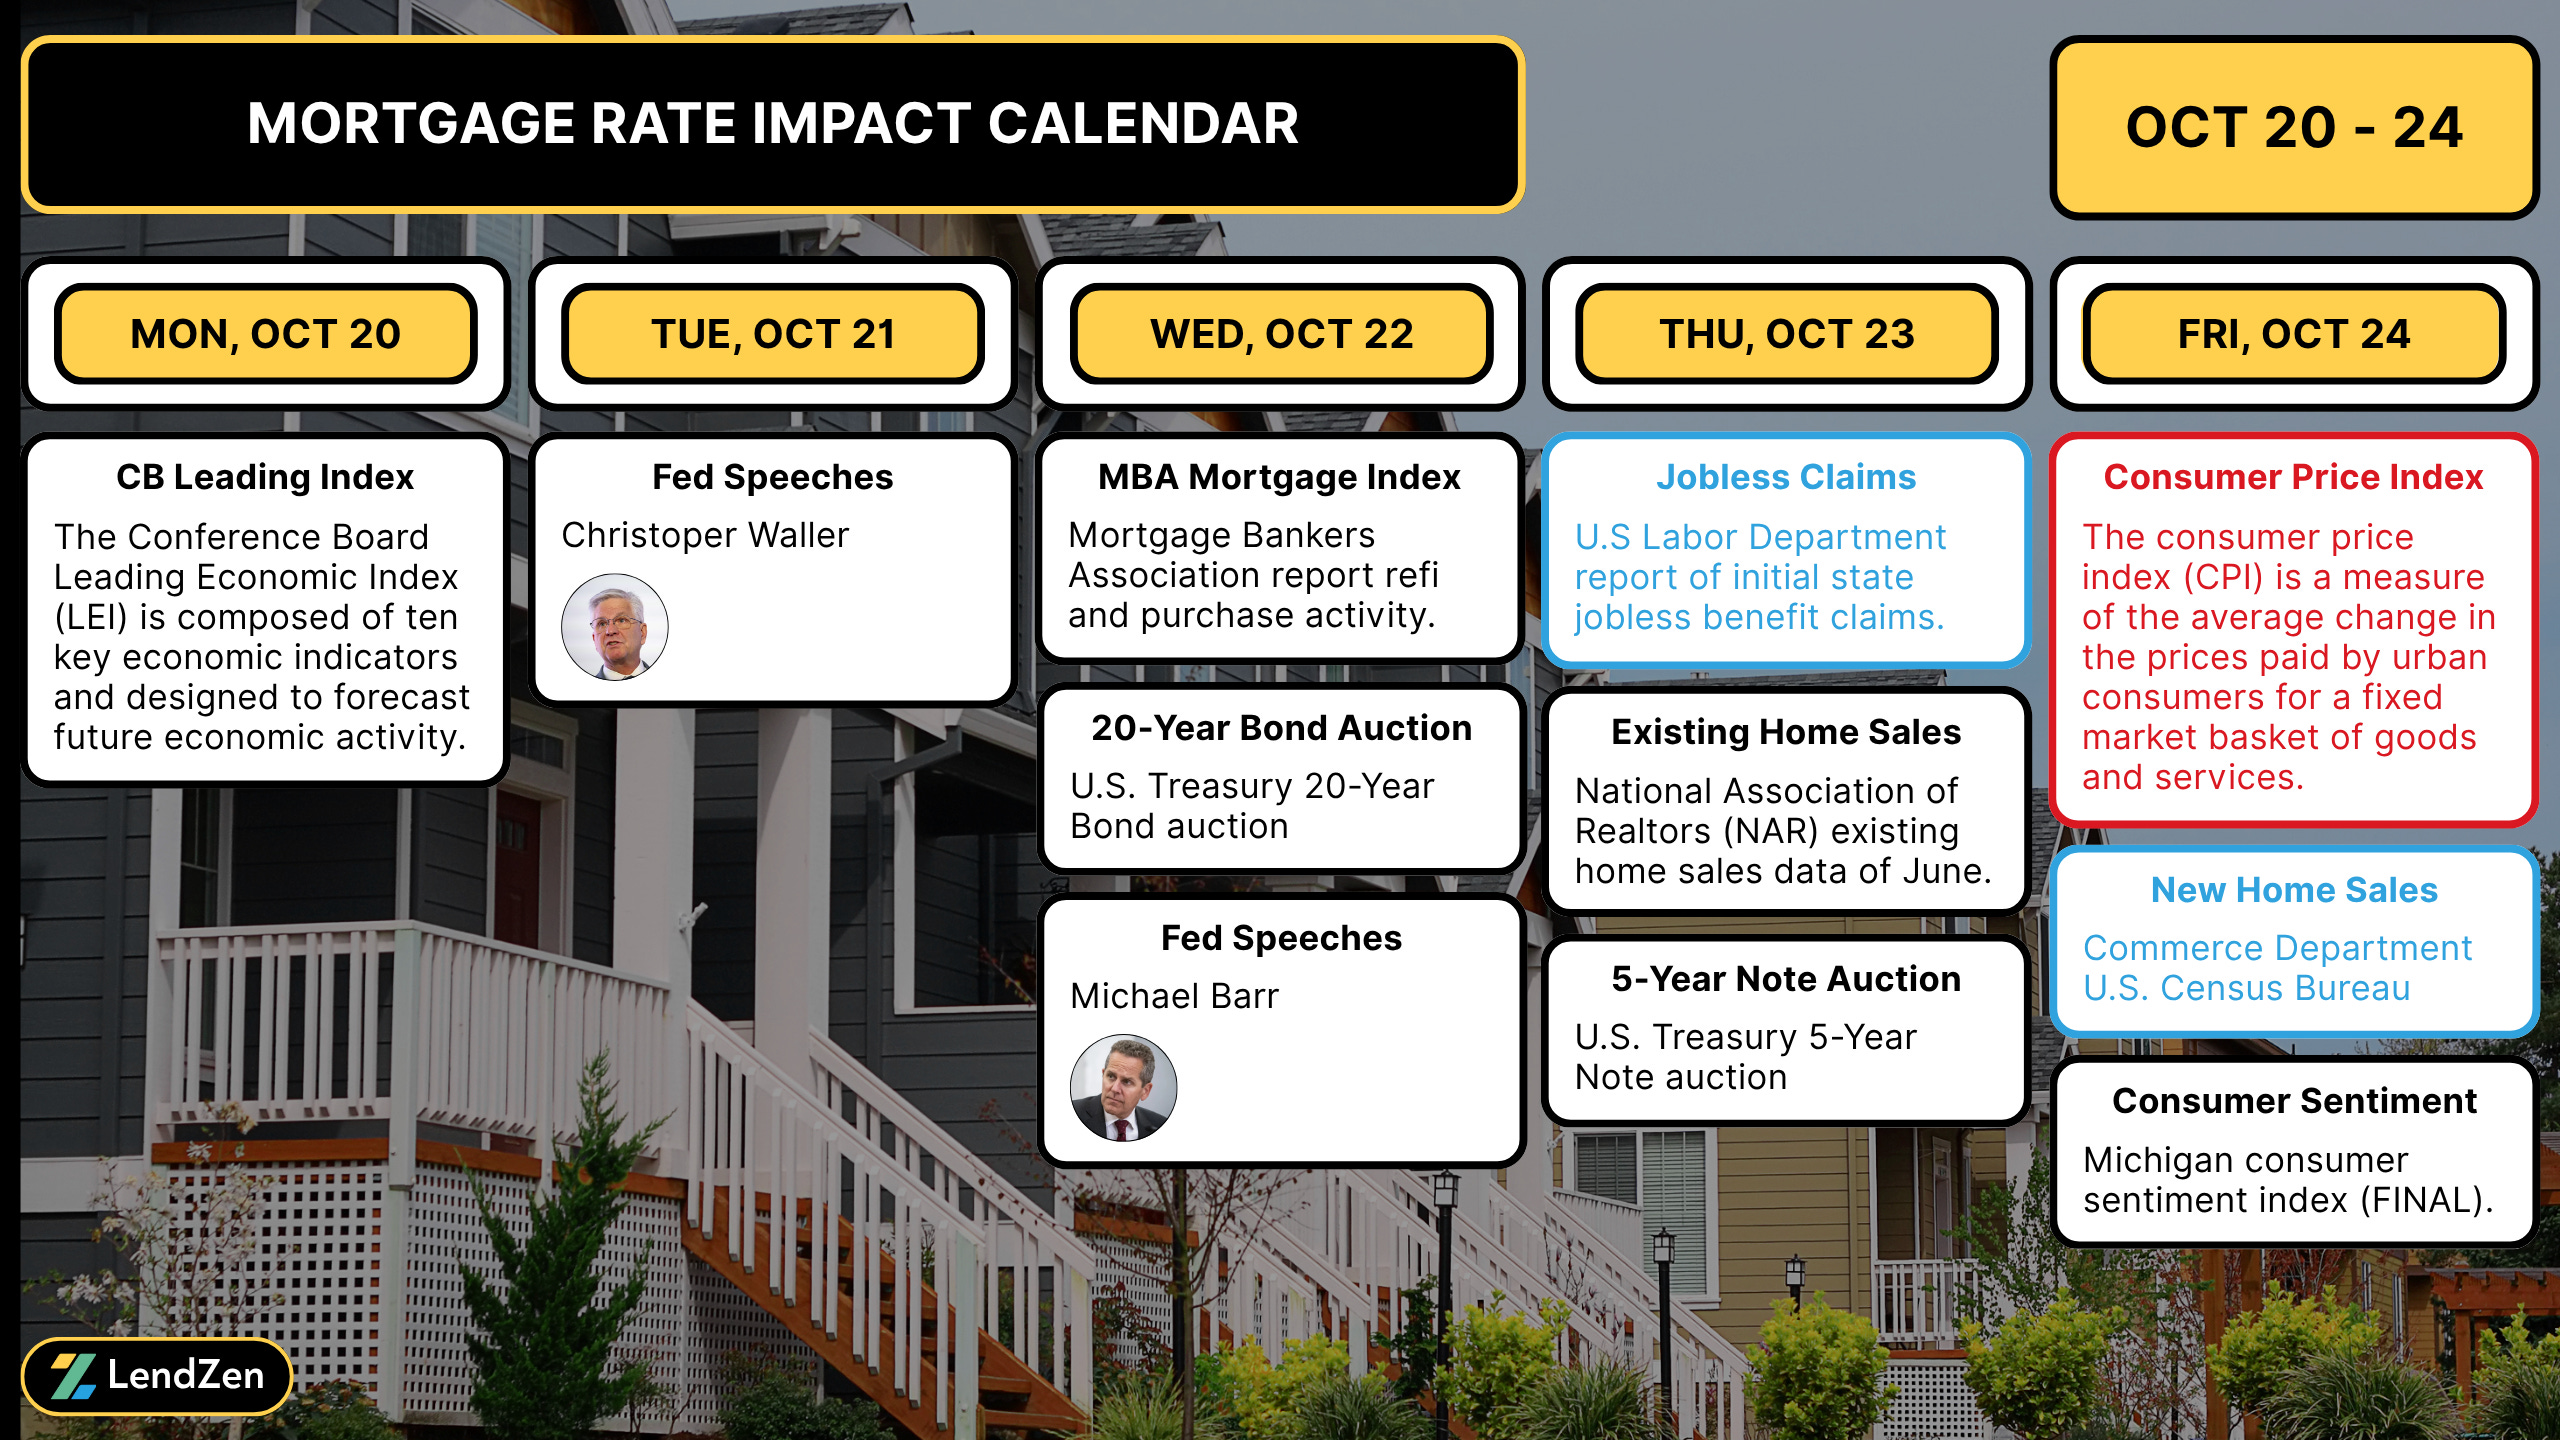
Deeper analysis - be sure to read the lock risk scores at the bottom of this post for a more detailed rationale of what could impact mortgage rates in the weeks ahead.
MARKET RECAP 📉
------------------
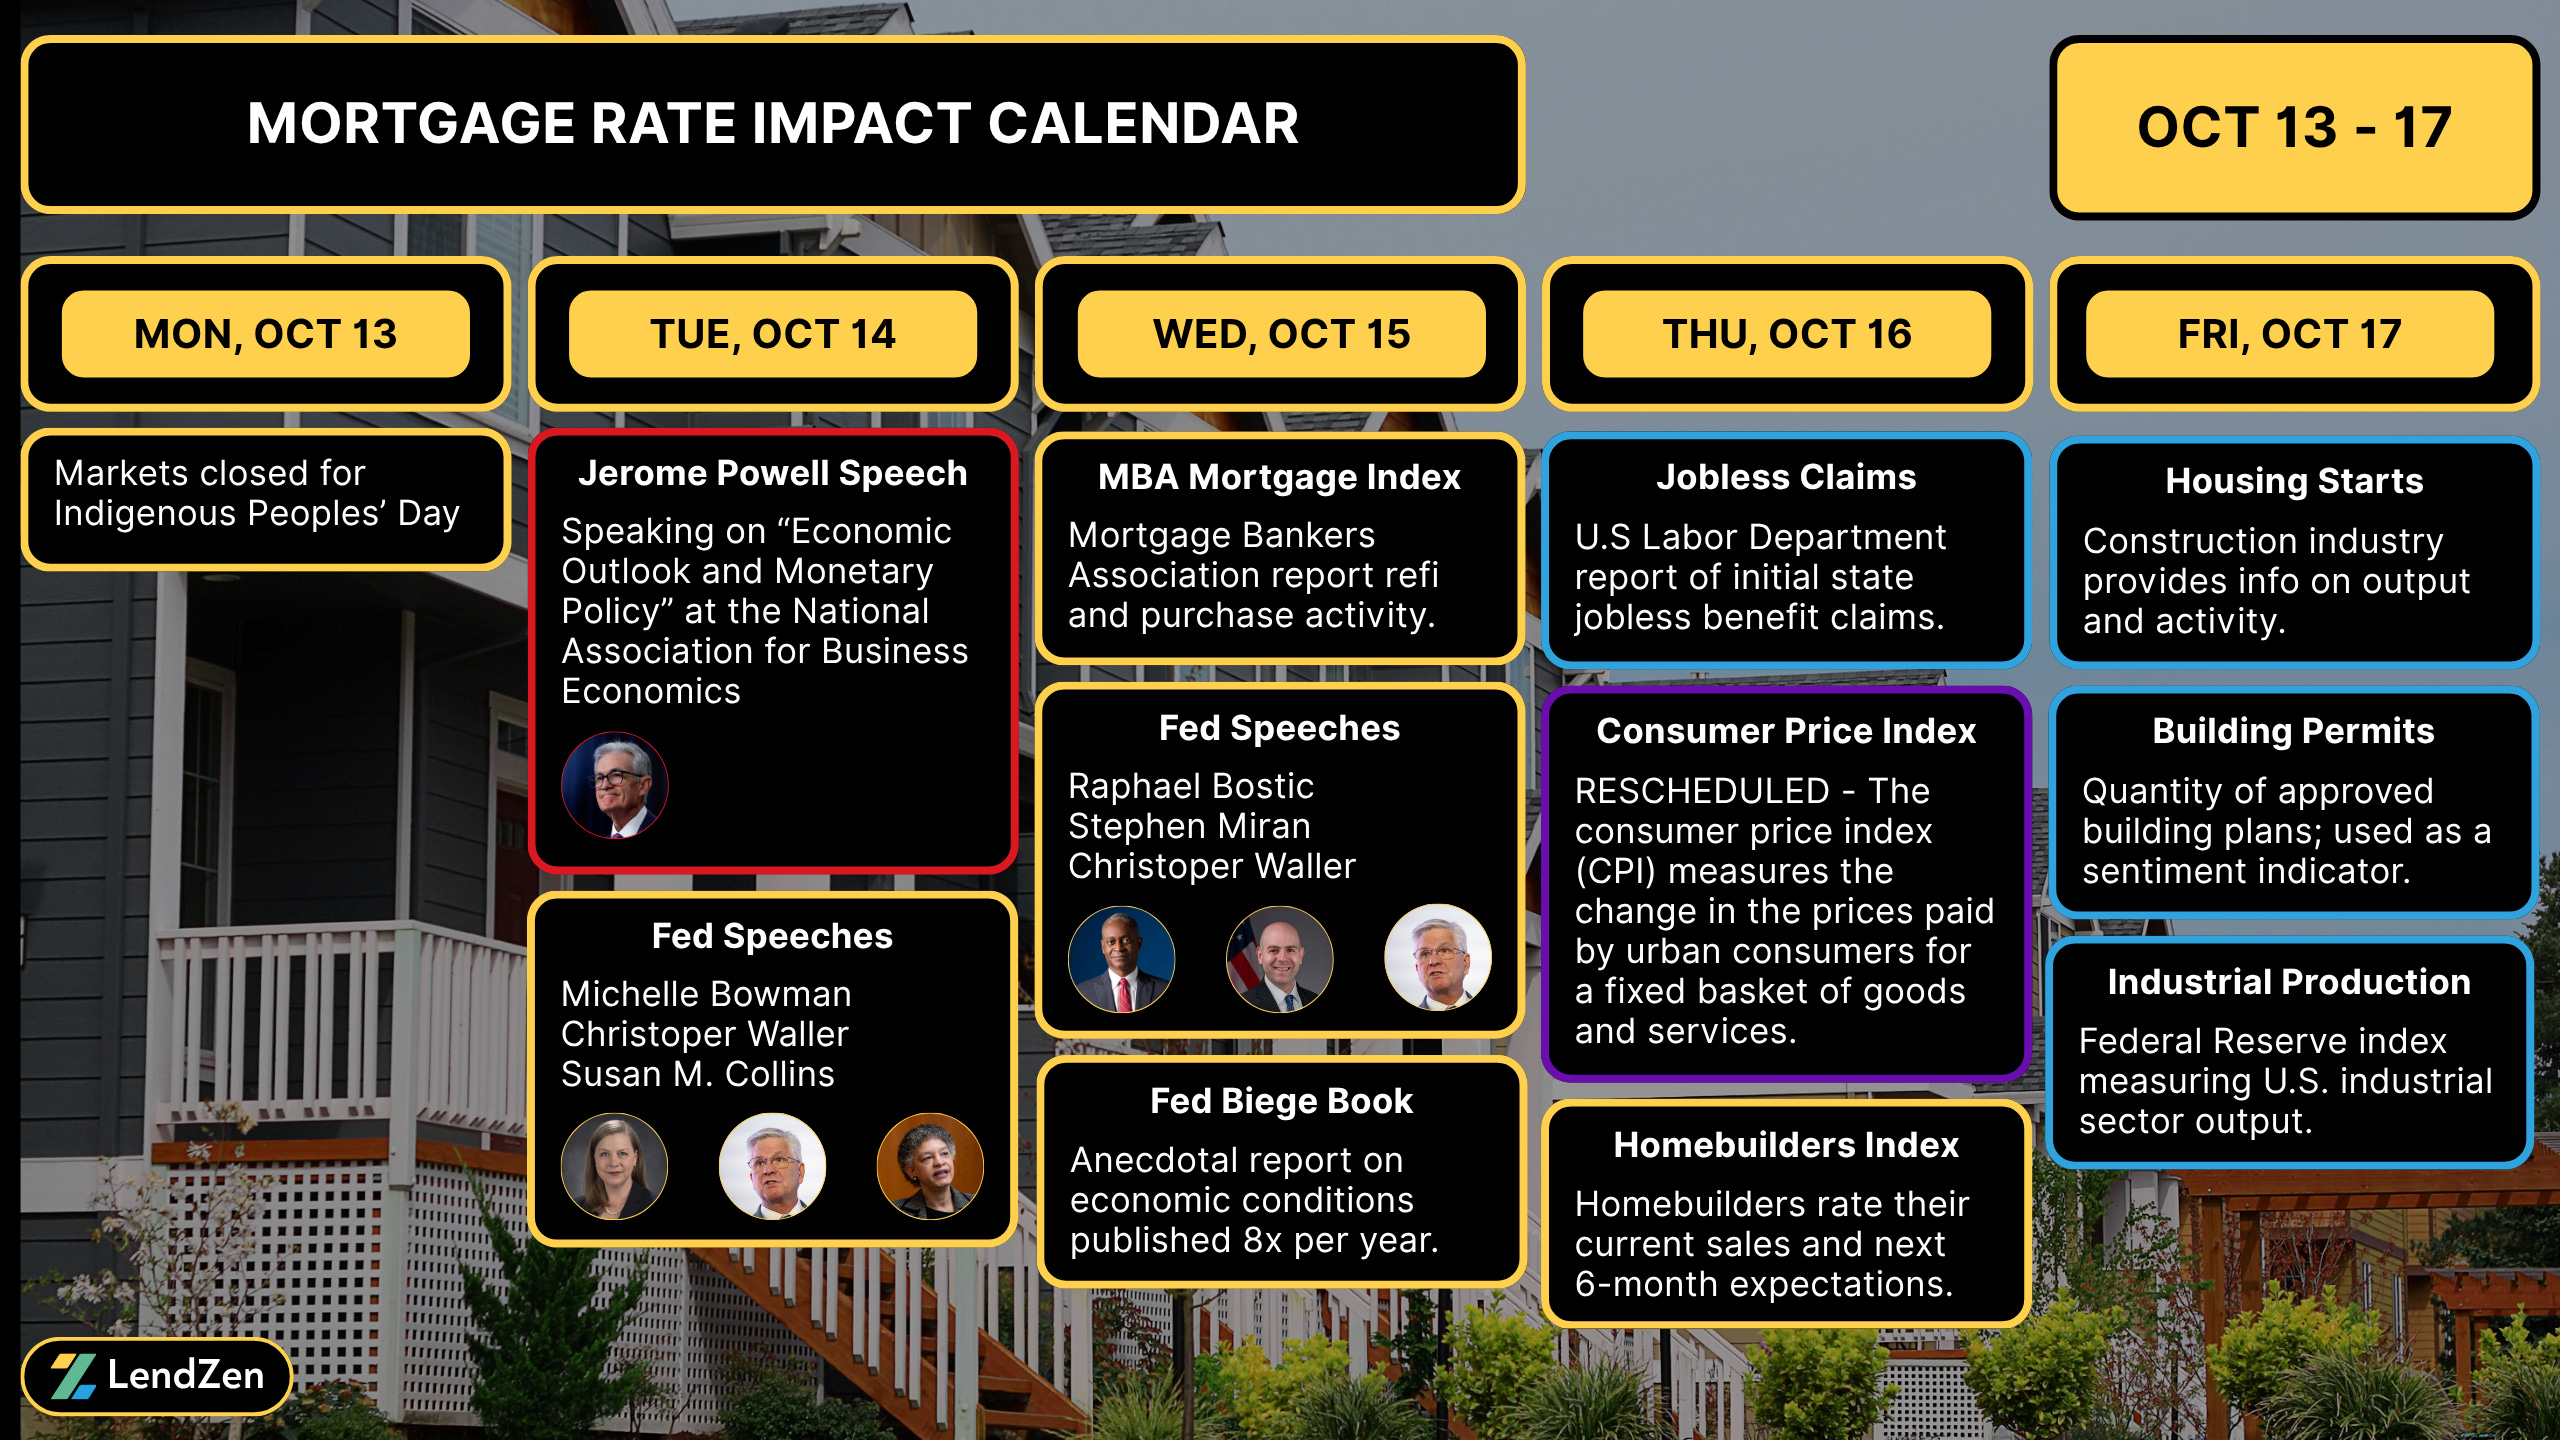
Despite the chaos on Capitol Hill, mortgage rates have been surprisingly calm, with a slow-steady grind back to the best levels of the last few years.
With CPI rescheduled to this Friday, the calendar had little to offer besides Fed speeches, and those proved to be uneventful.
The same storylines as week’s prior continued to hold investor’s attention, while critical econ data remained on hold amidst the shutdown.
One key theme was the rise of Gold.
Prior to last week, gold was performing far better than bonds as a risk-off hedge, something I discussed in this previous Substack post.
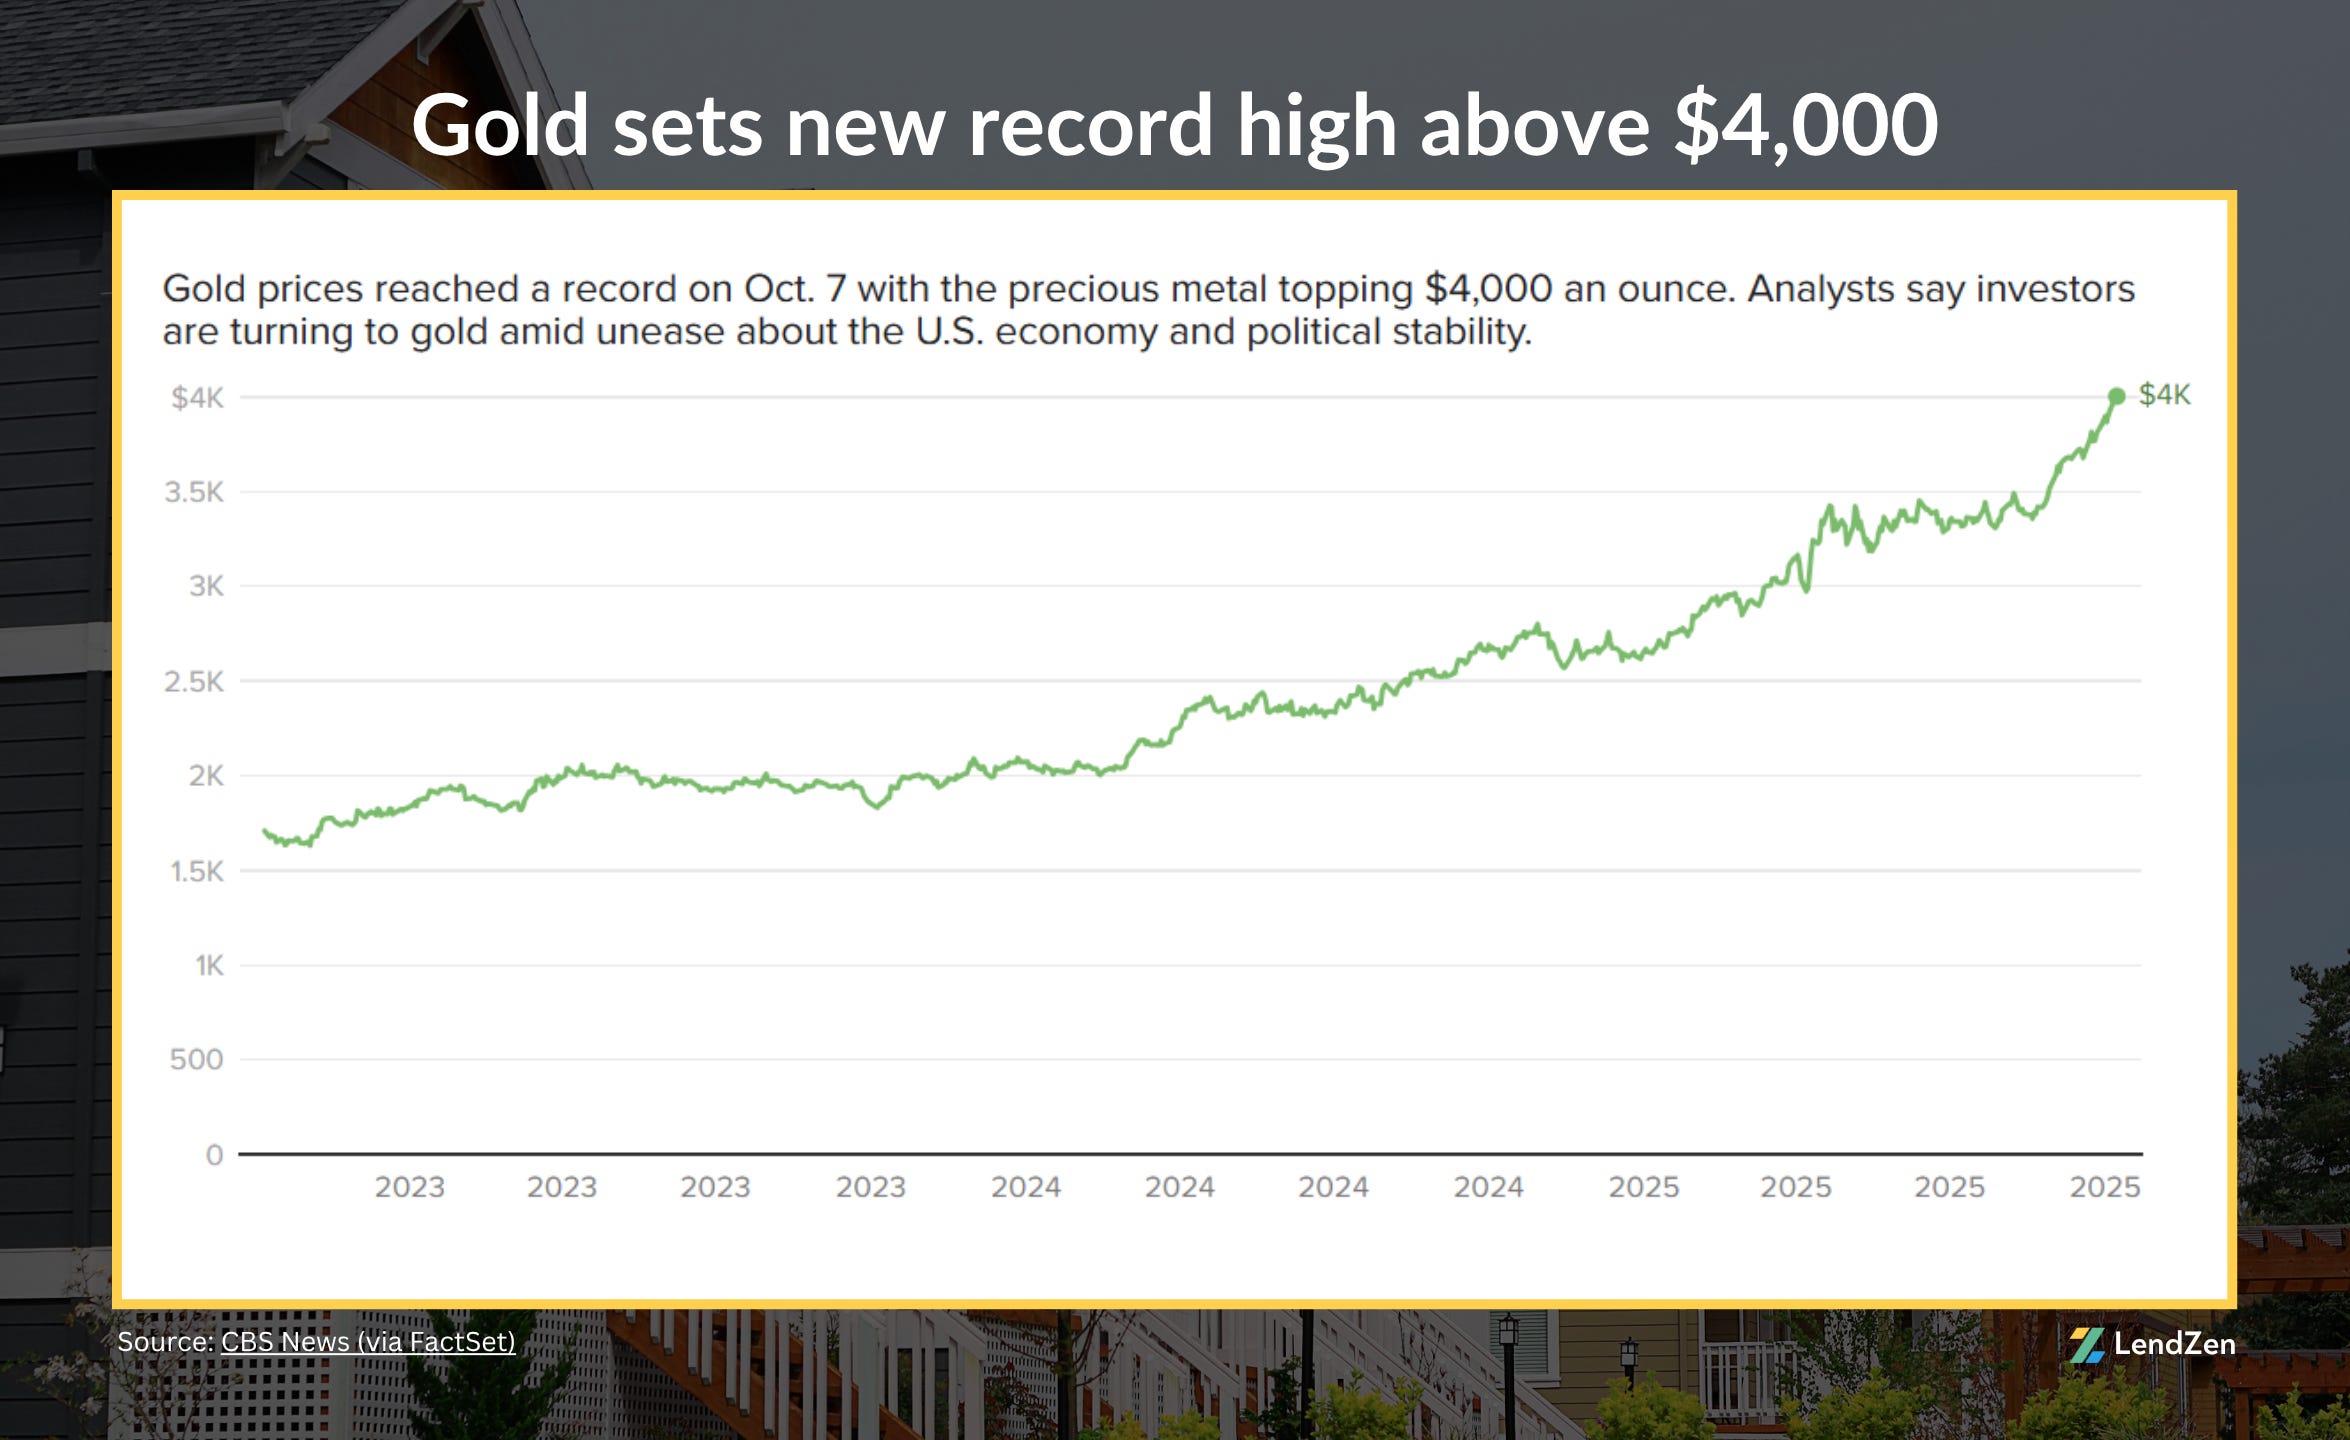
However, after cresting the $4K level for the first time ever, gold has lost some steam, but only down a few percent since the recent all-time high it too looks to be waiting for CPI before deciding which direction to go.
For more detailed coverage of the week ahead check out yesterday’s Substack Post.

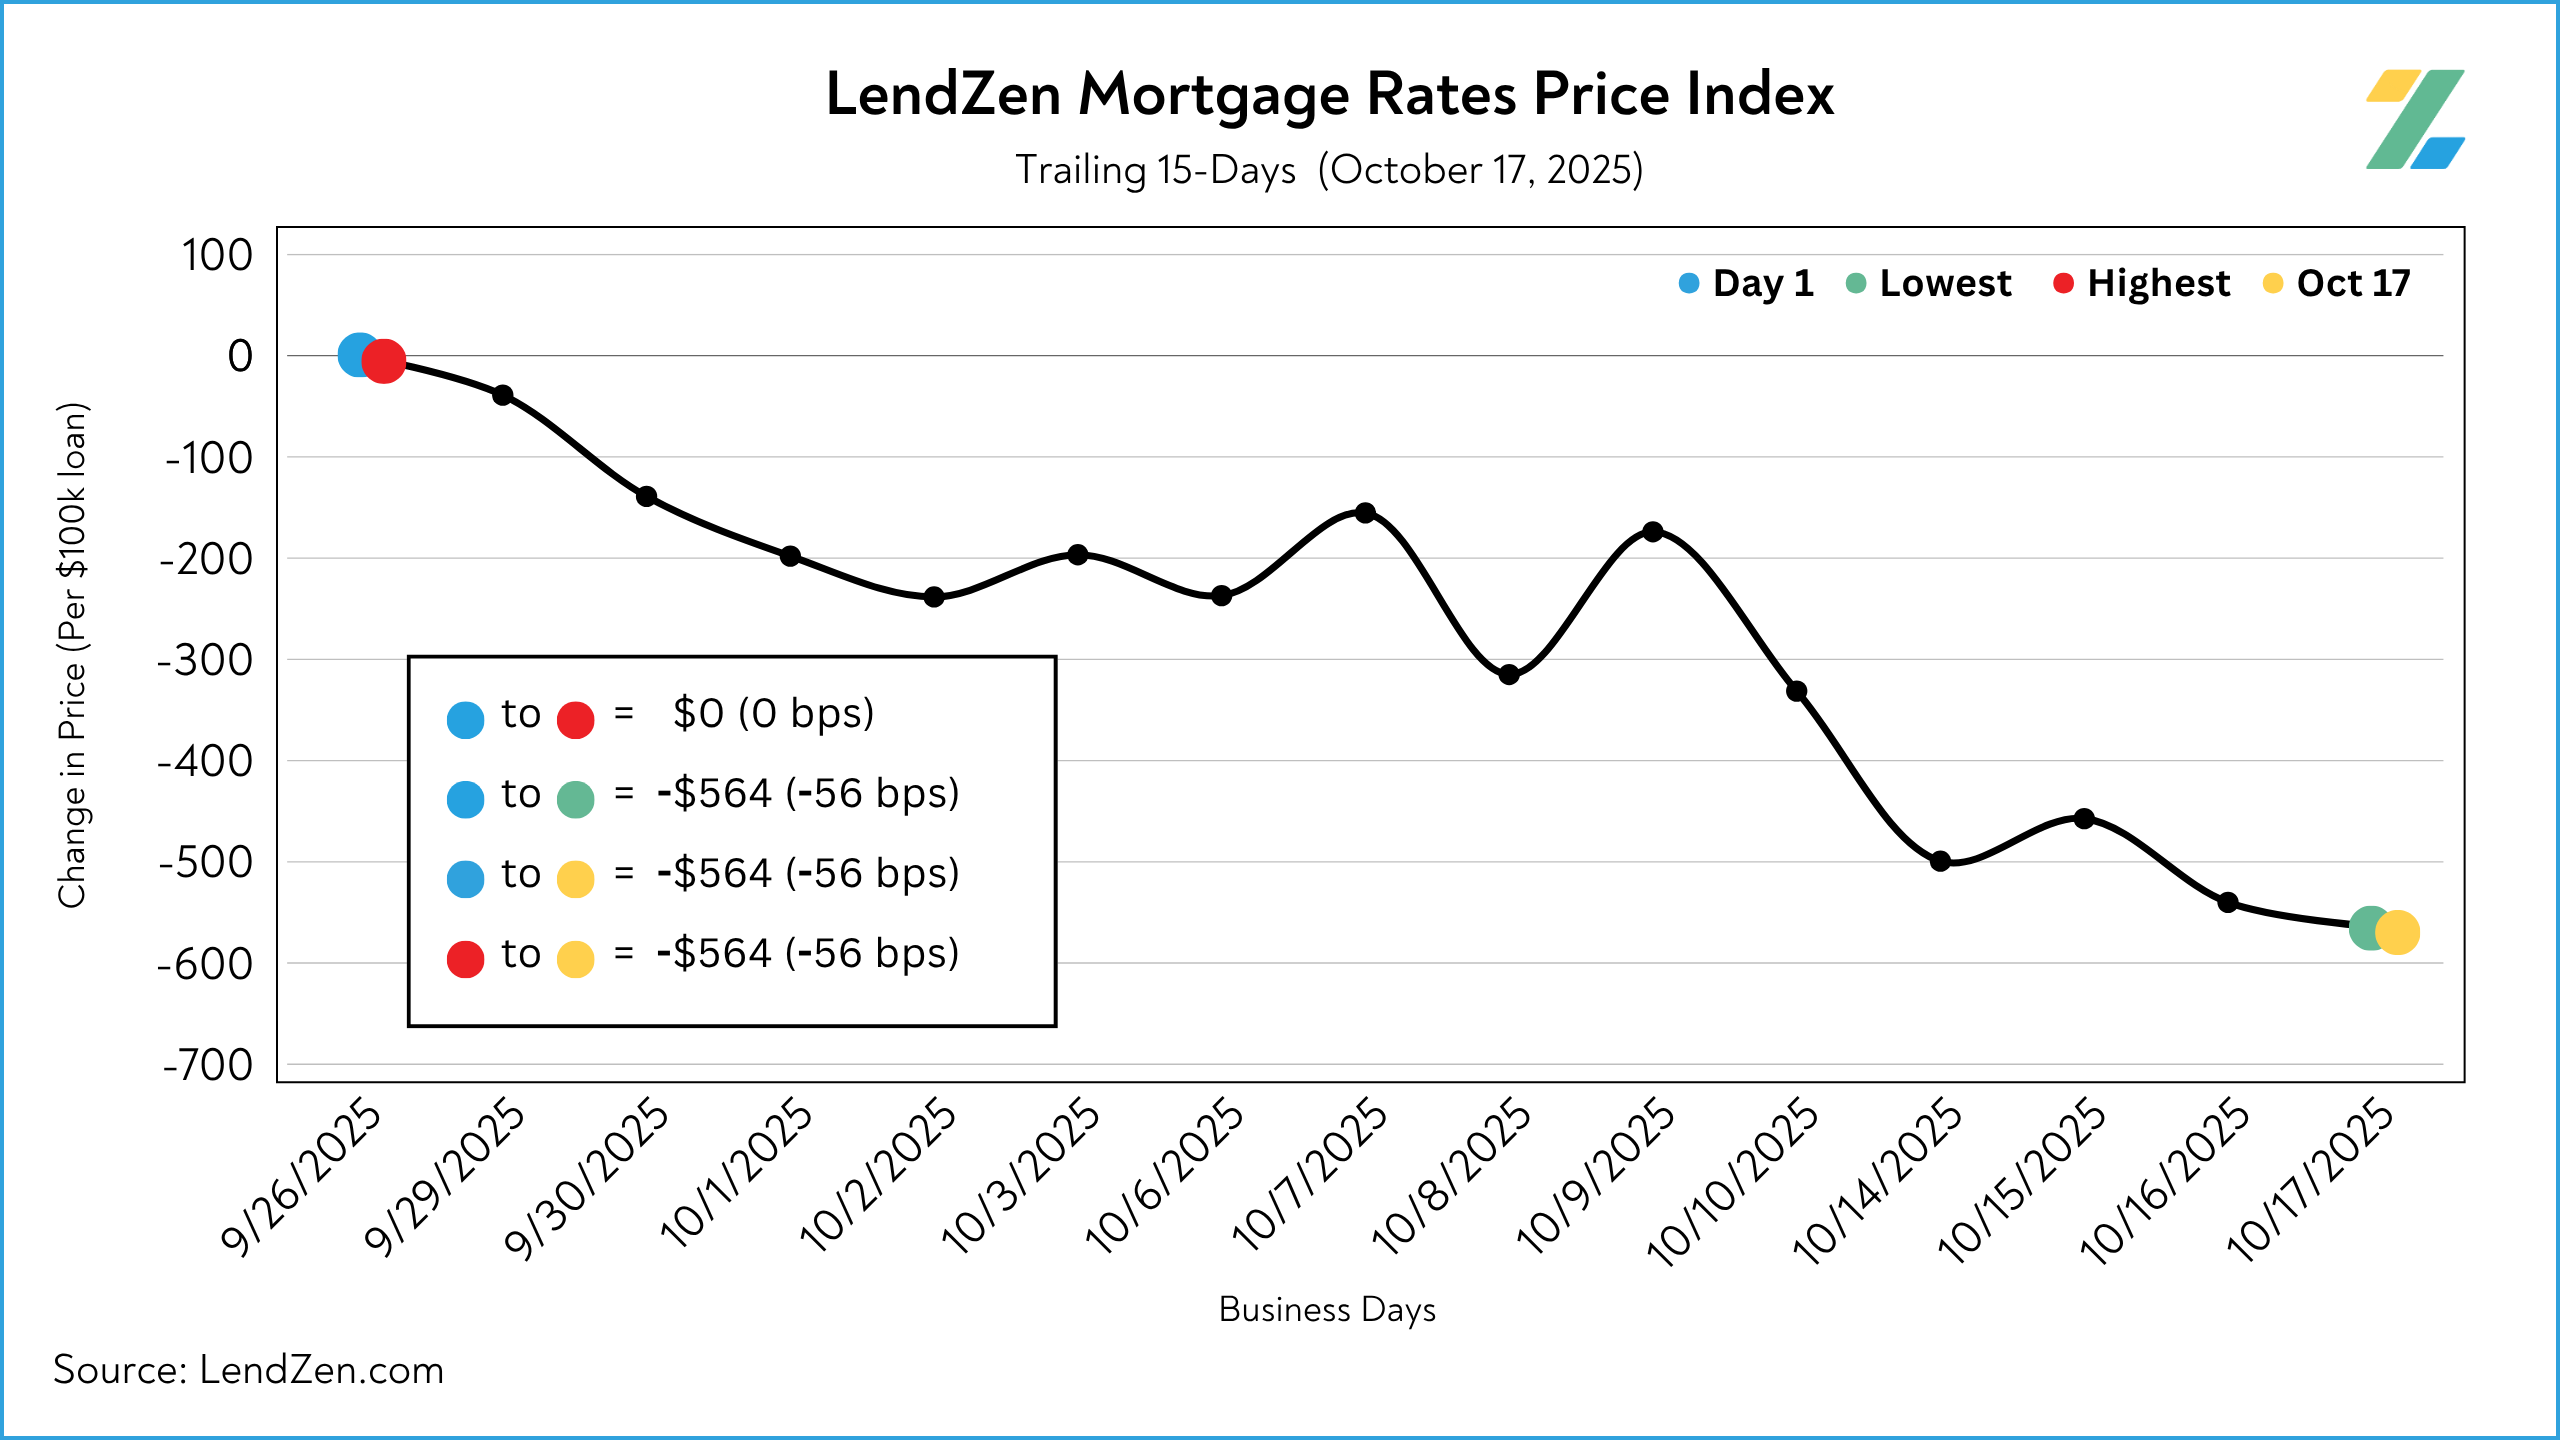
MORTGAGE RATE PRICES 📉
------------------------------
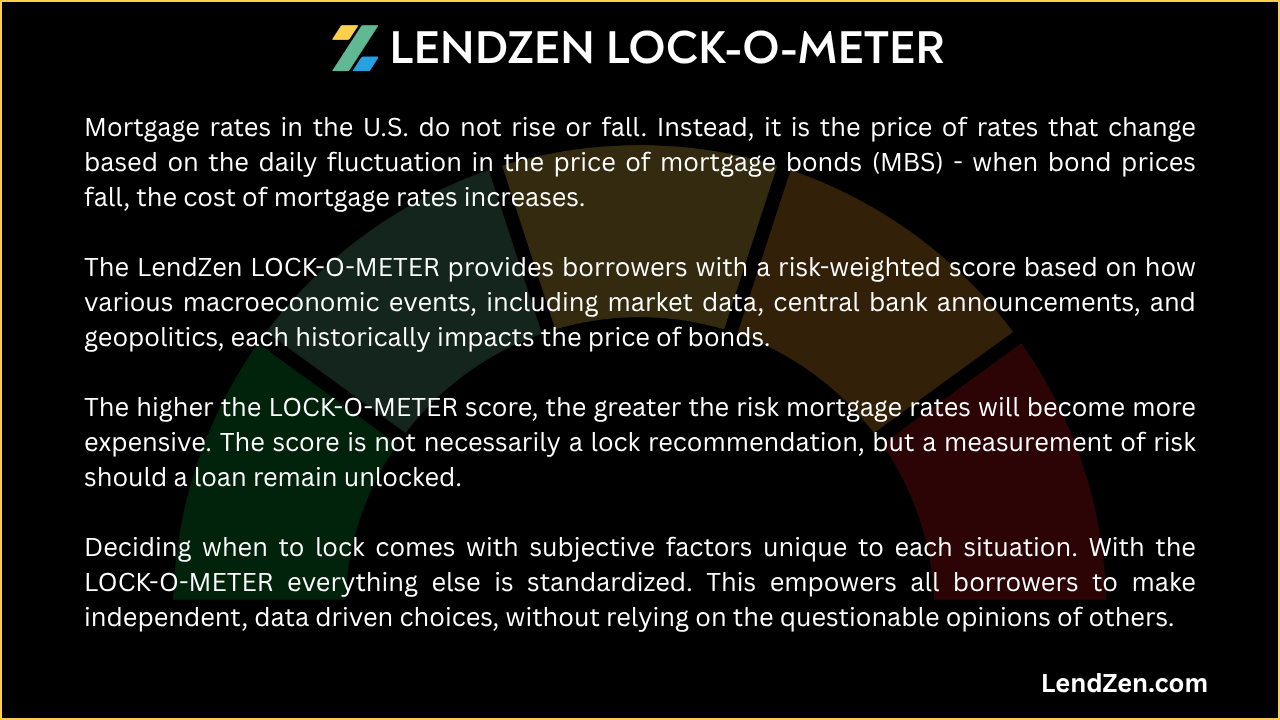
Mortgage rates do not rise or fall, instead the PRICE of rates change.
The LendZen Index calculates a daily change in the price of mortgage rates by tracking a spectrum of mortgage-backed securities (MBS).
This provides borrowers with a more specific measurement of how the cost to obtain a mortgage is changing, regardless of the lender, rate, or credit score.
-----------
10/17/2025
-----------
24-Hour: -2 bps (-$24 per $100K)
5-Day: -23 bps (-$232)
10-Day: -37 bps (-$367)
30-Day: -31 bps (-$312)
Since July 15: -258 bps (-$2,578 less expensive per $100K)
Friday was an exceptionally quiet one for bonds - depending on the exact rate a borrower is monitoring pricing was either slightly better, flat, or even down 1-2 bps.
Although Friday was a yawn, the week overall ended positively, down 23 bps.
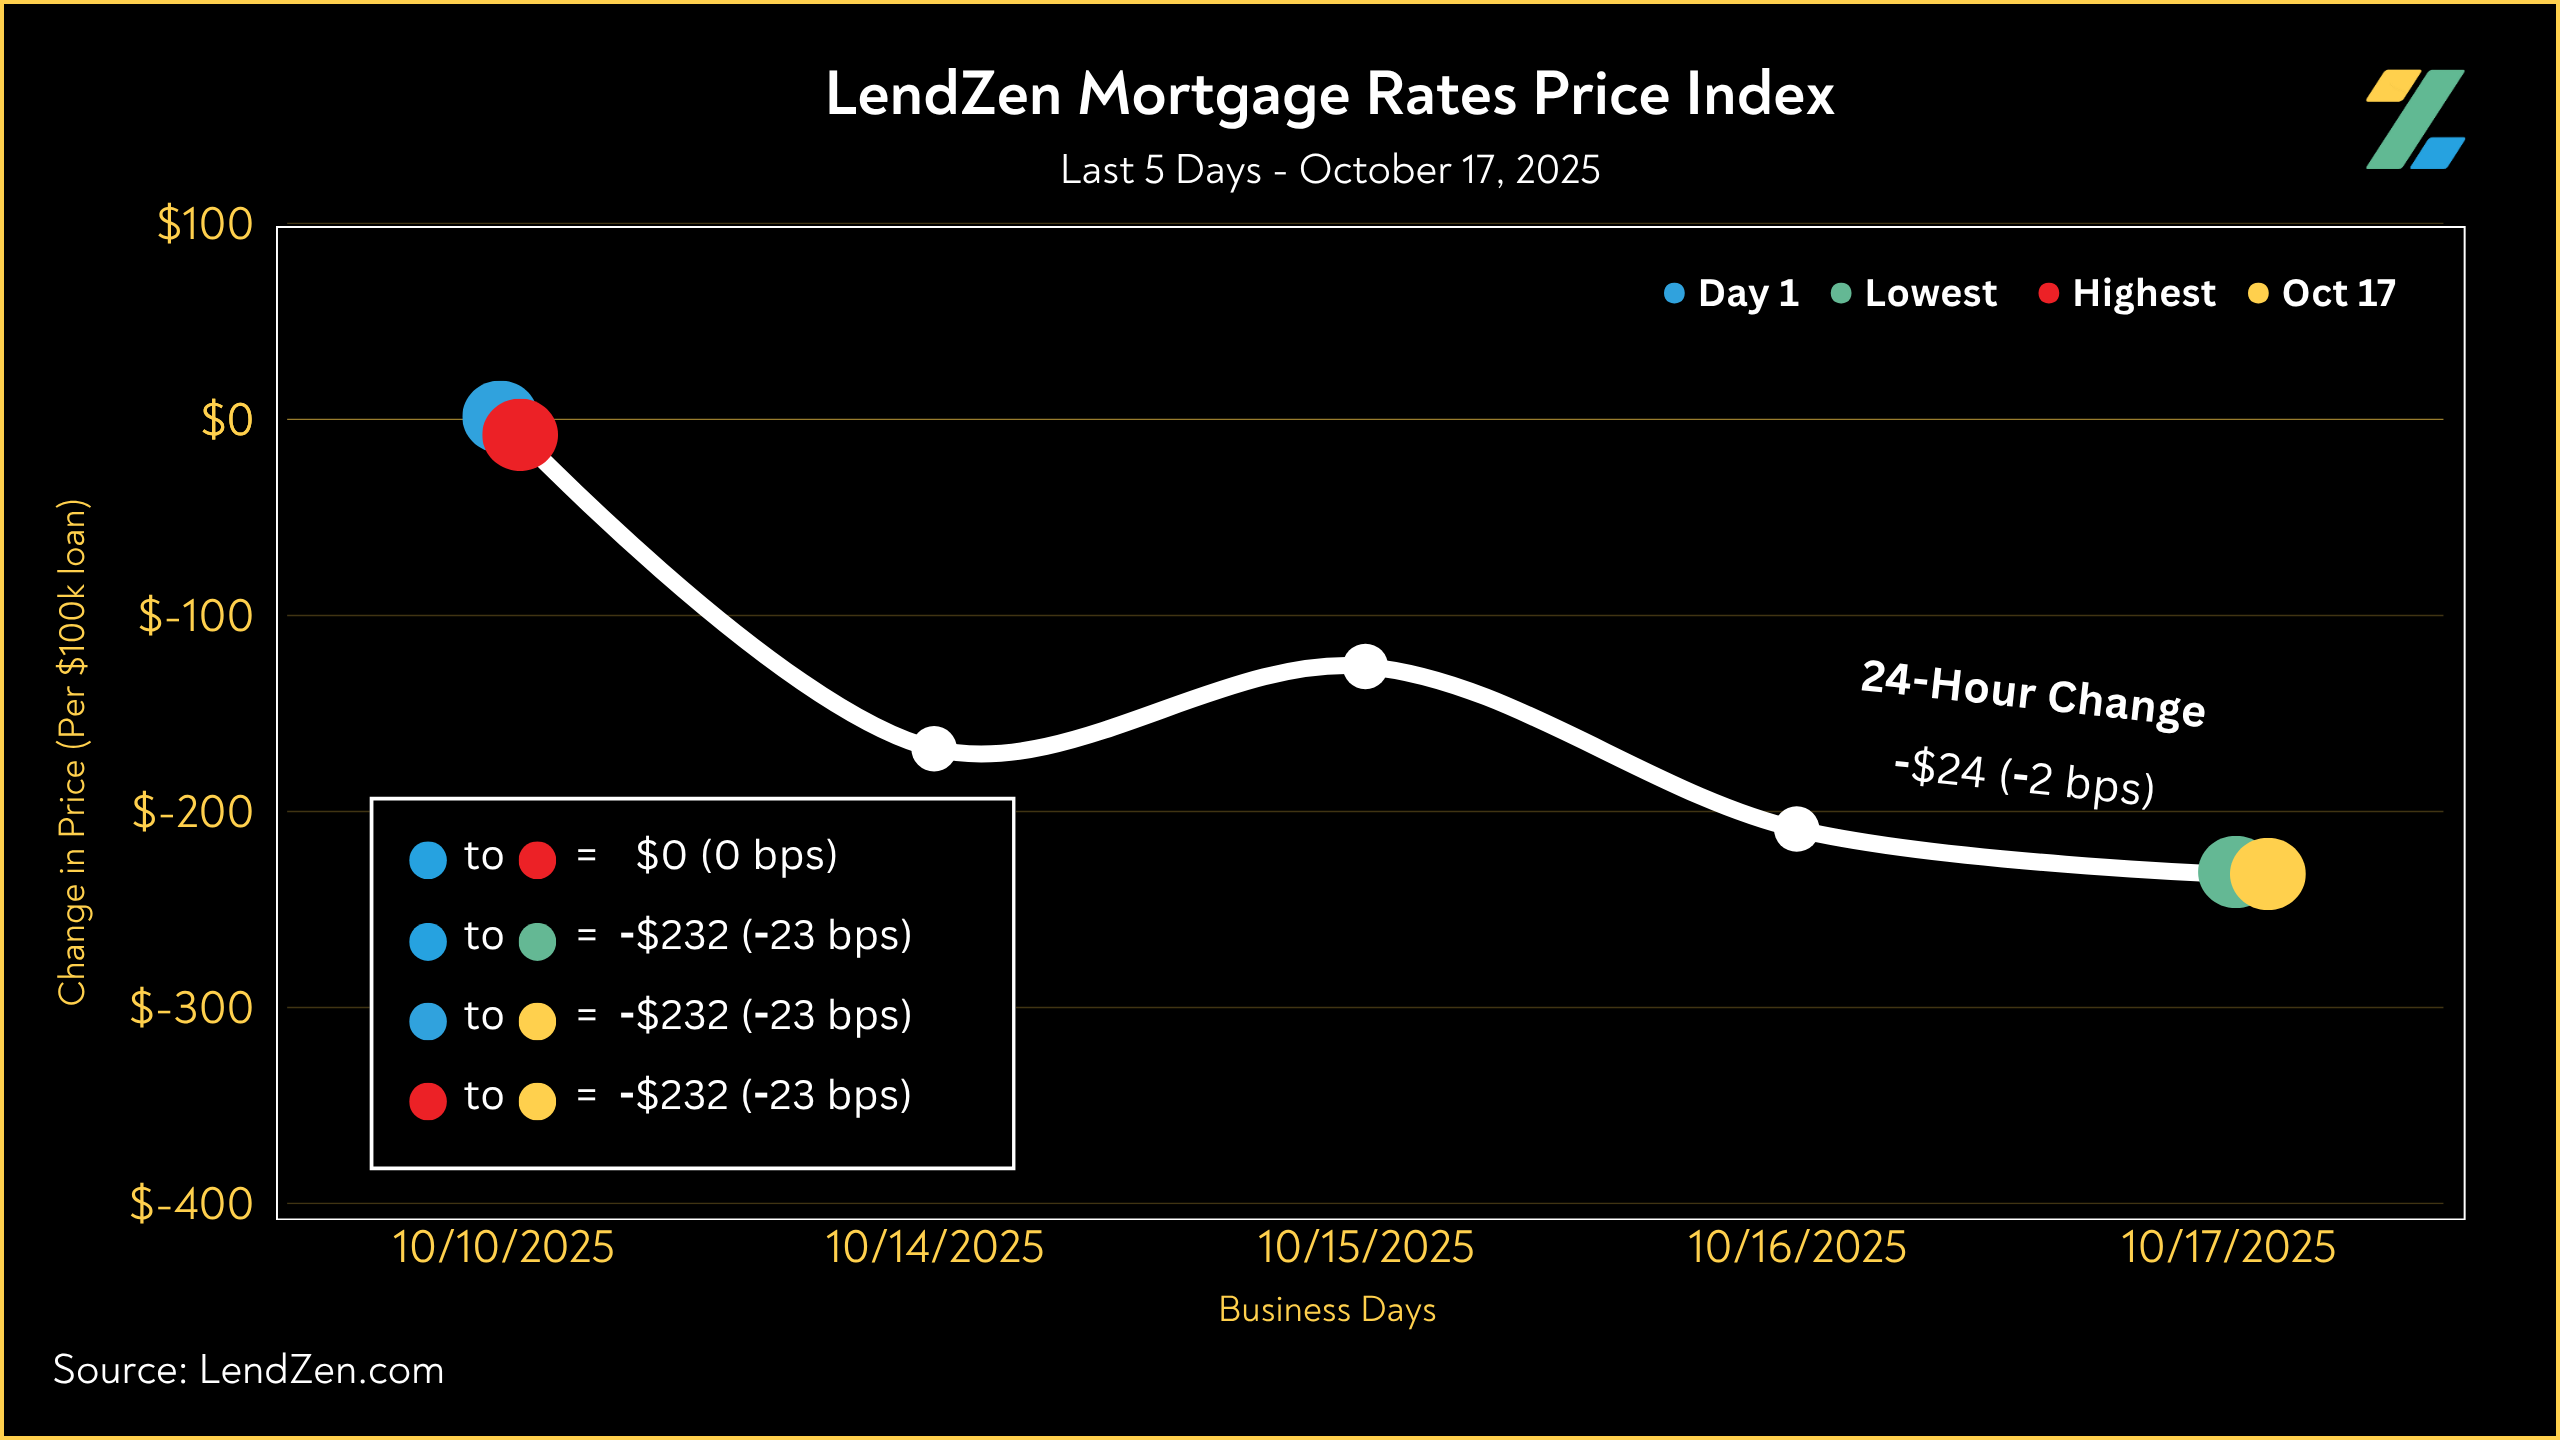
The picture becomes a bit more pleasant when we look at the ground covered in the last 30-days.
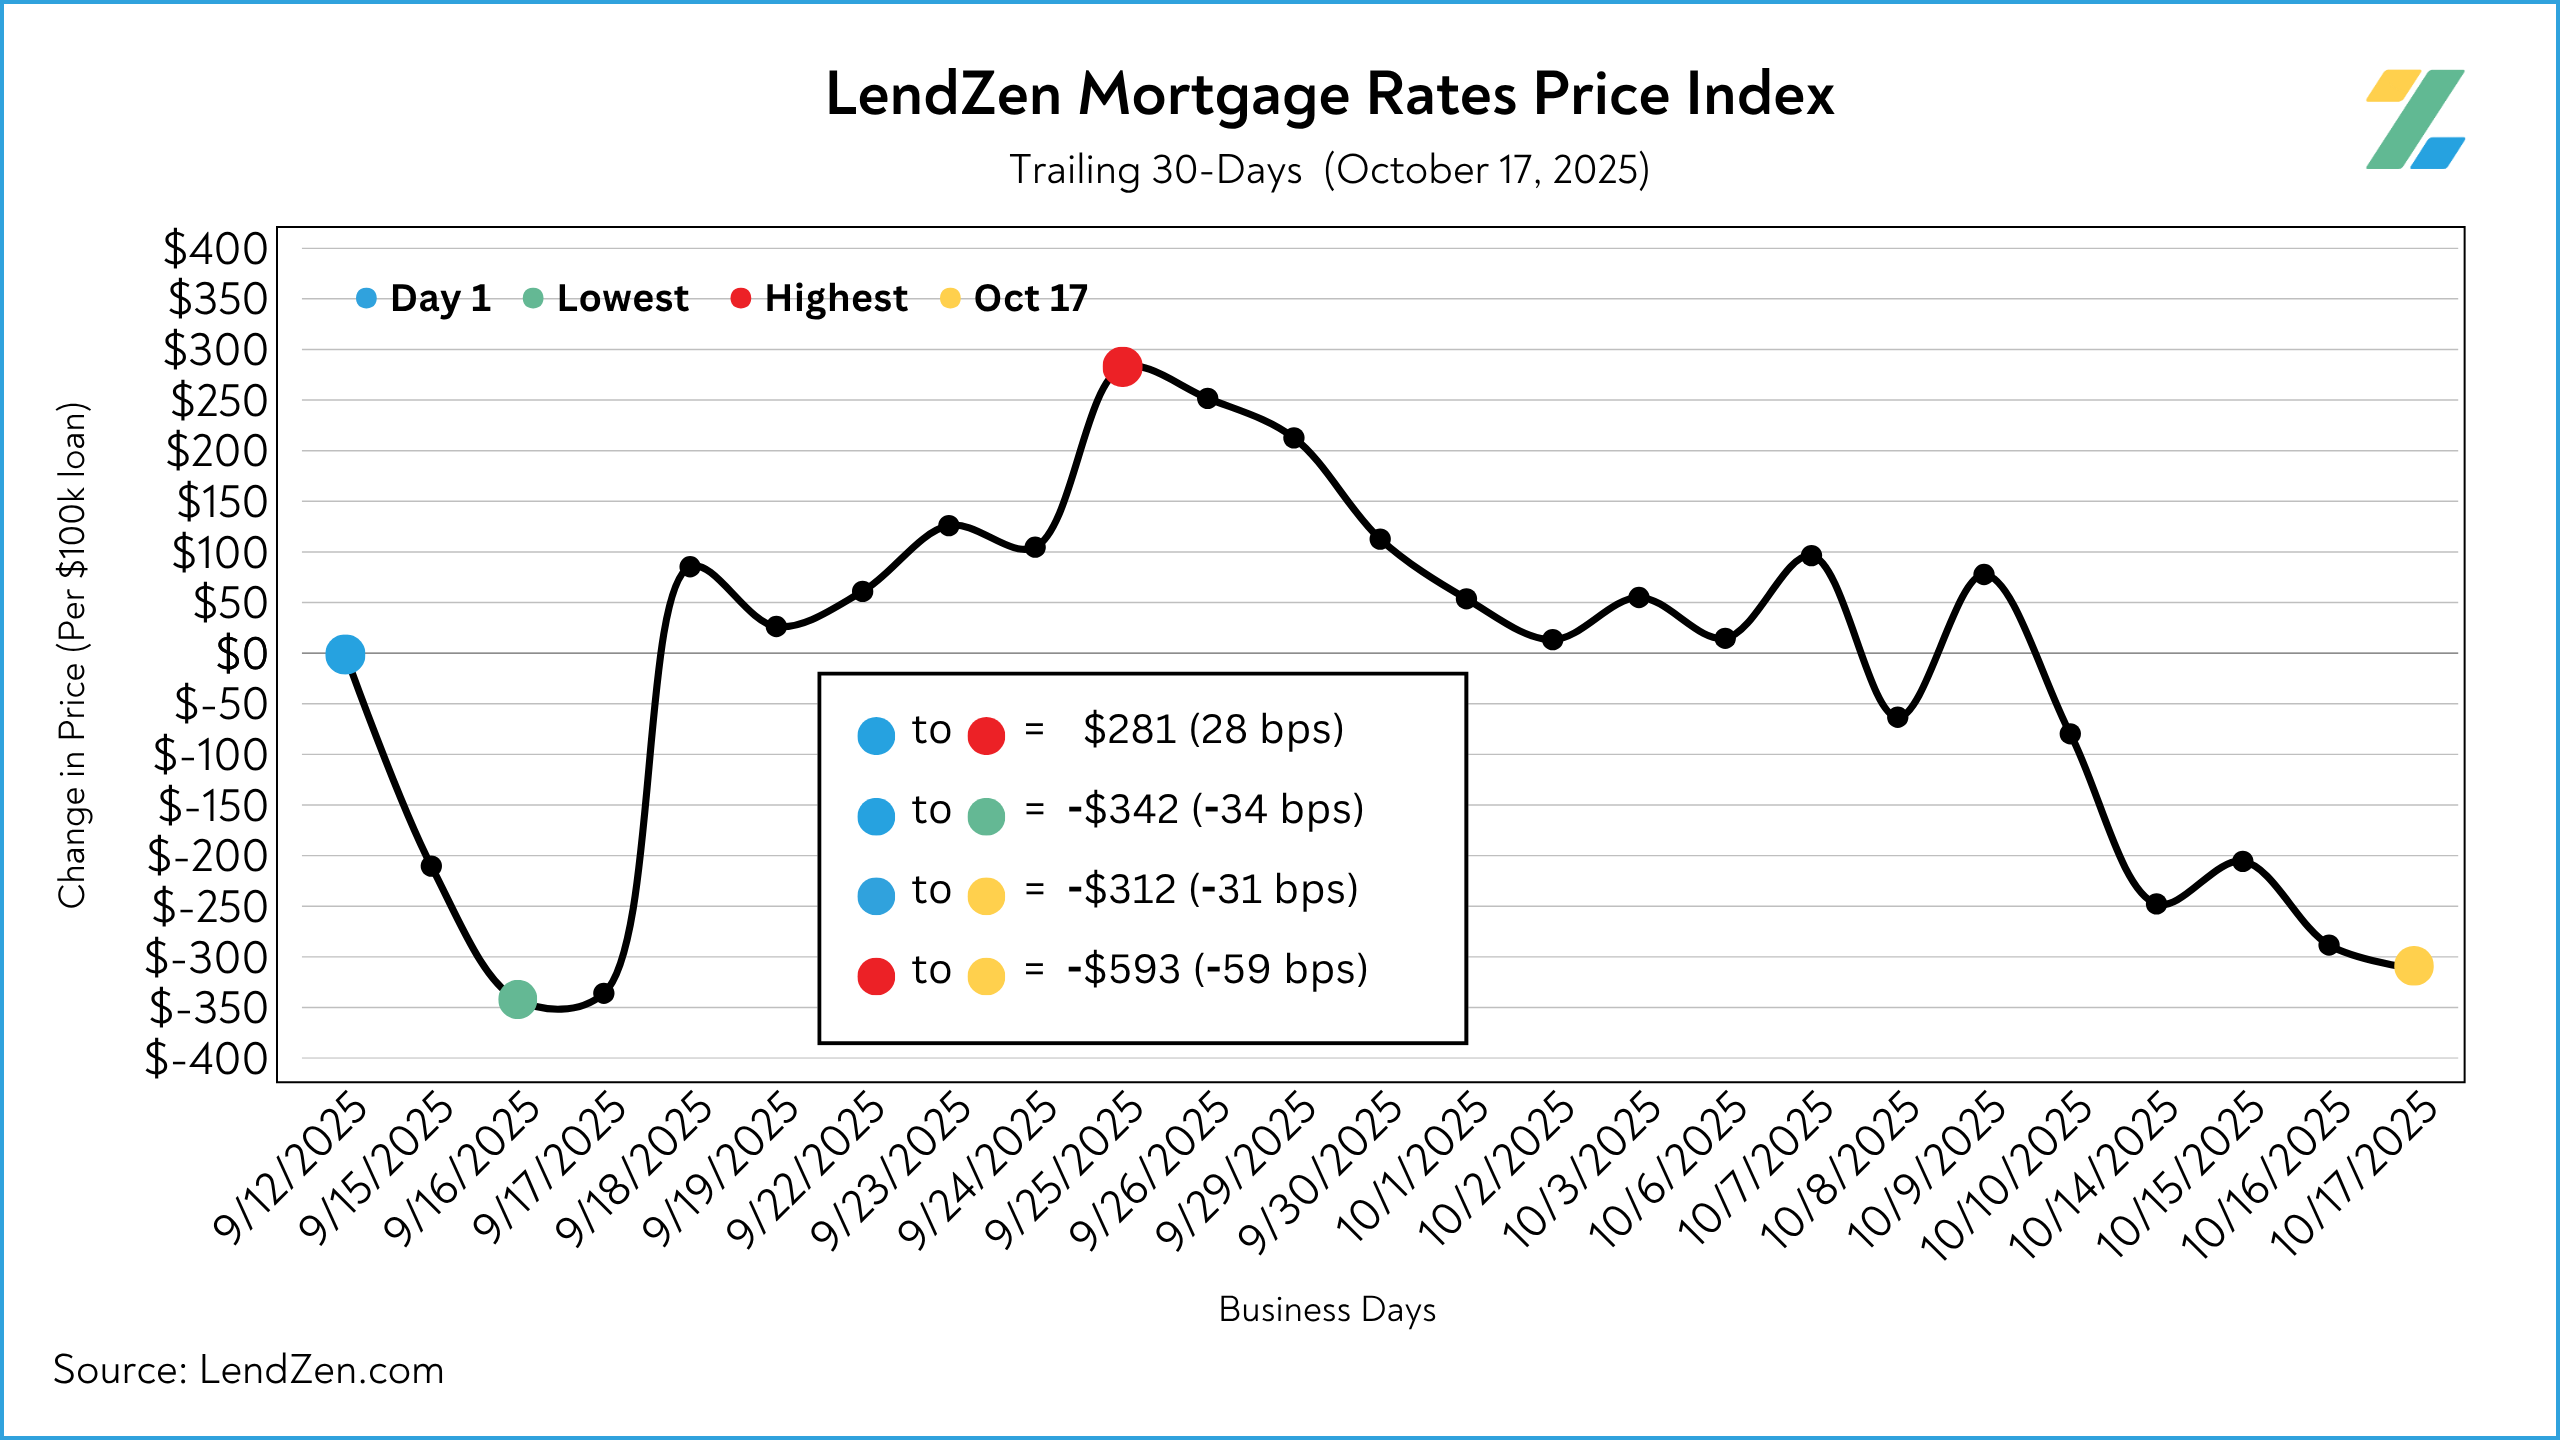
The longer-term trend is reason to rejoice, as we’ve enjoyed a 250 bps improvement in mortgage rate prices since the July 15th high.
The LendZen Index monitors the change in price across a broad set of rates and mortgage bond coupons, whereas the LendZen Mortgage Rate Price Tracker is more a rate and loan program specific example of how mortgage rates do not rise or fall but instead it is their price that changes.
See Friday’s price tracker results on this Substack Post.

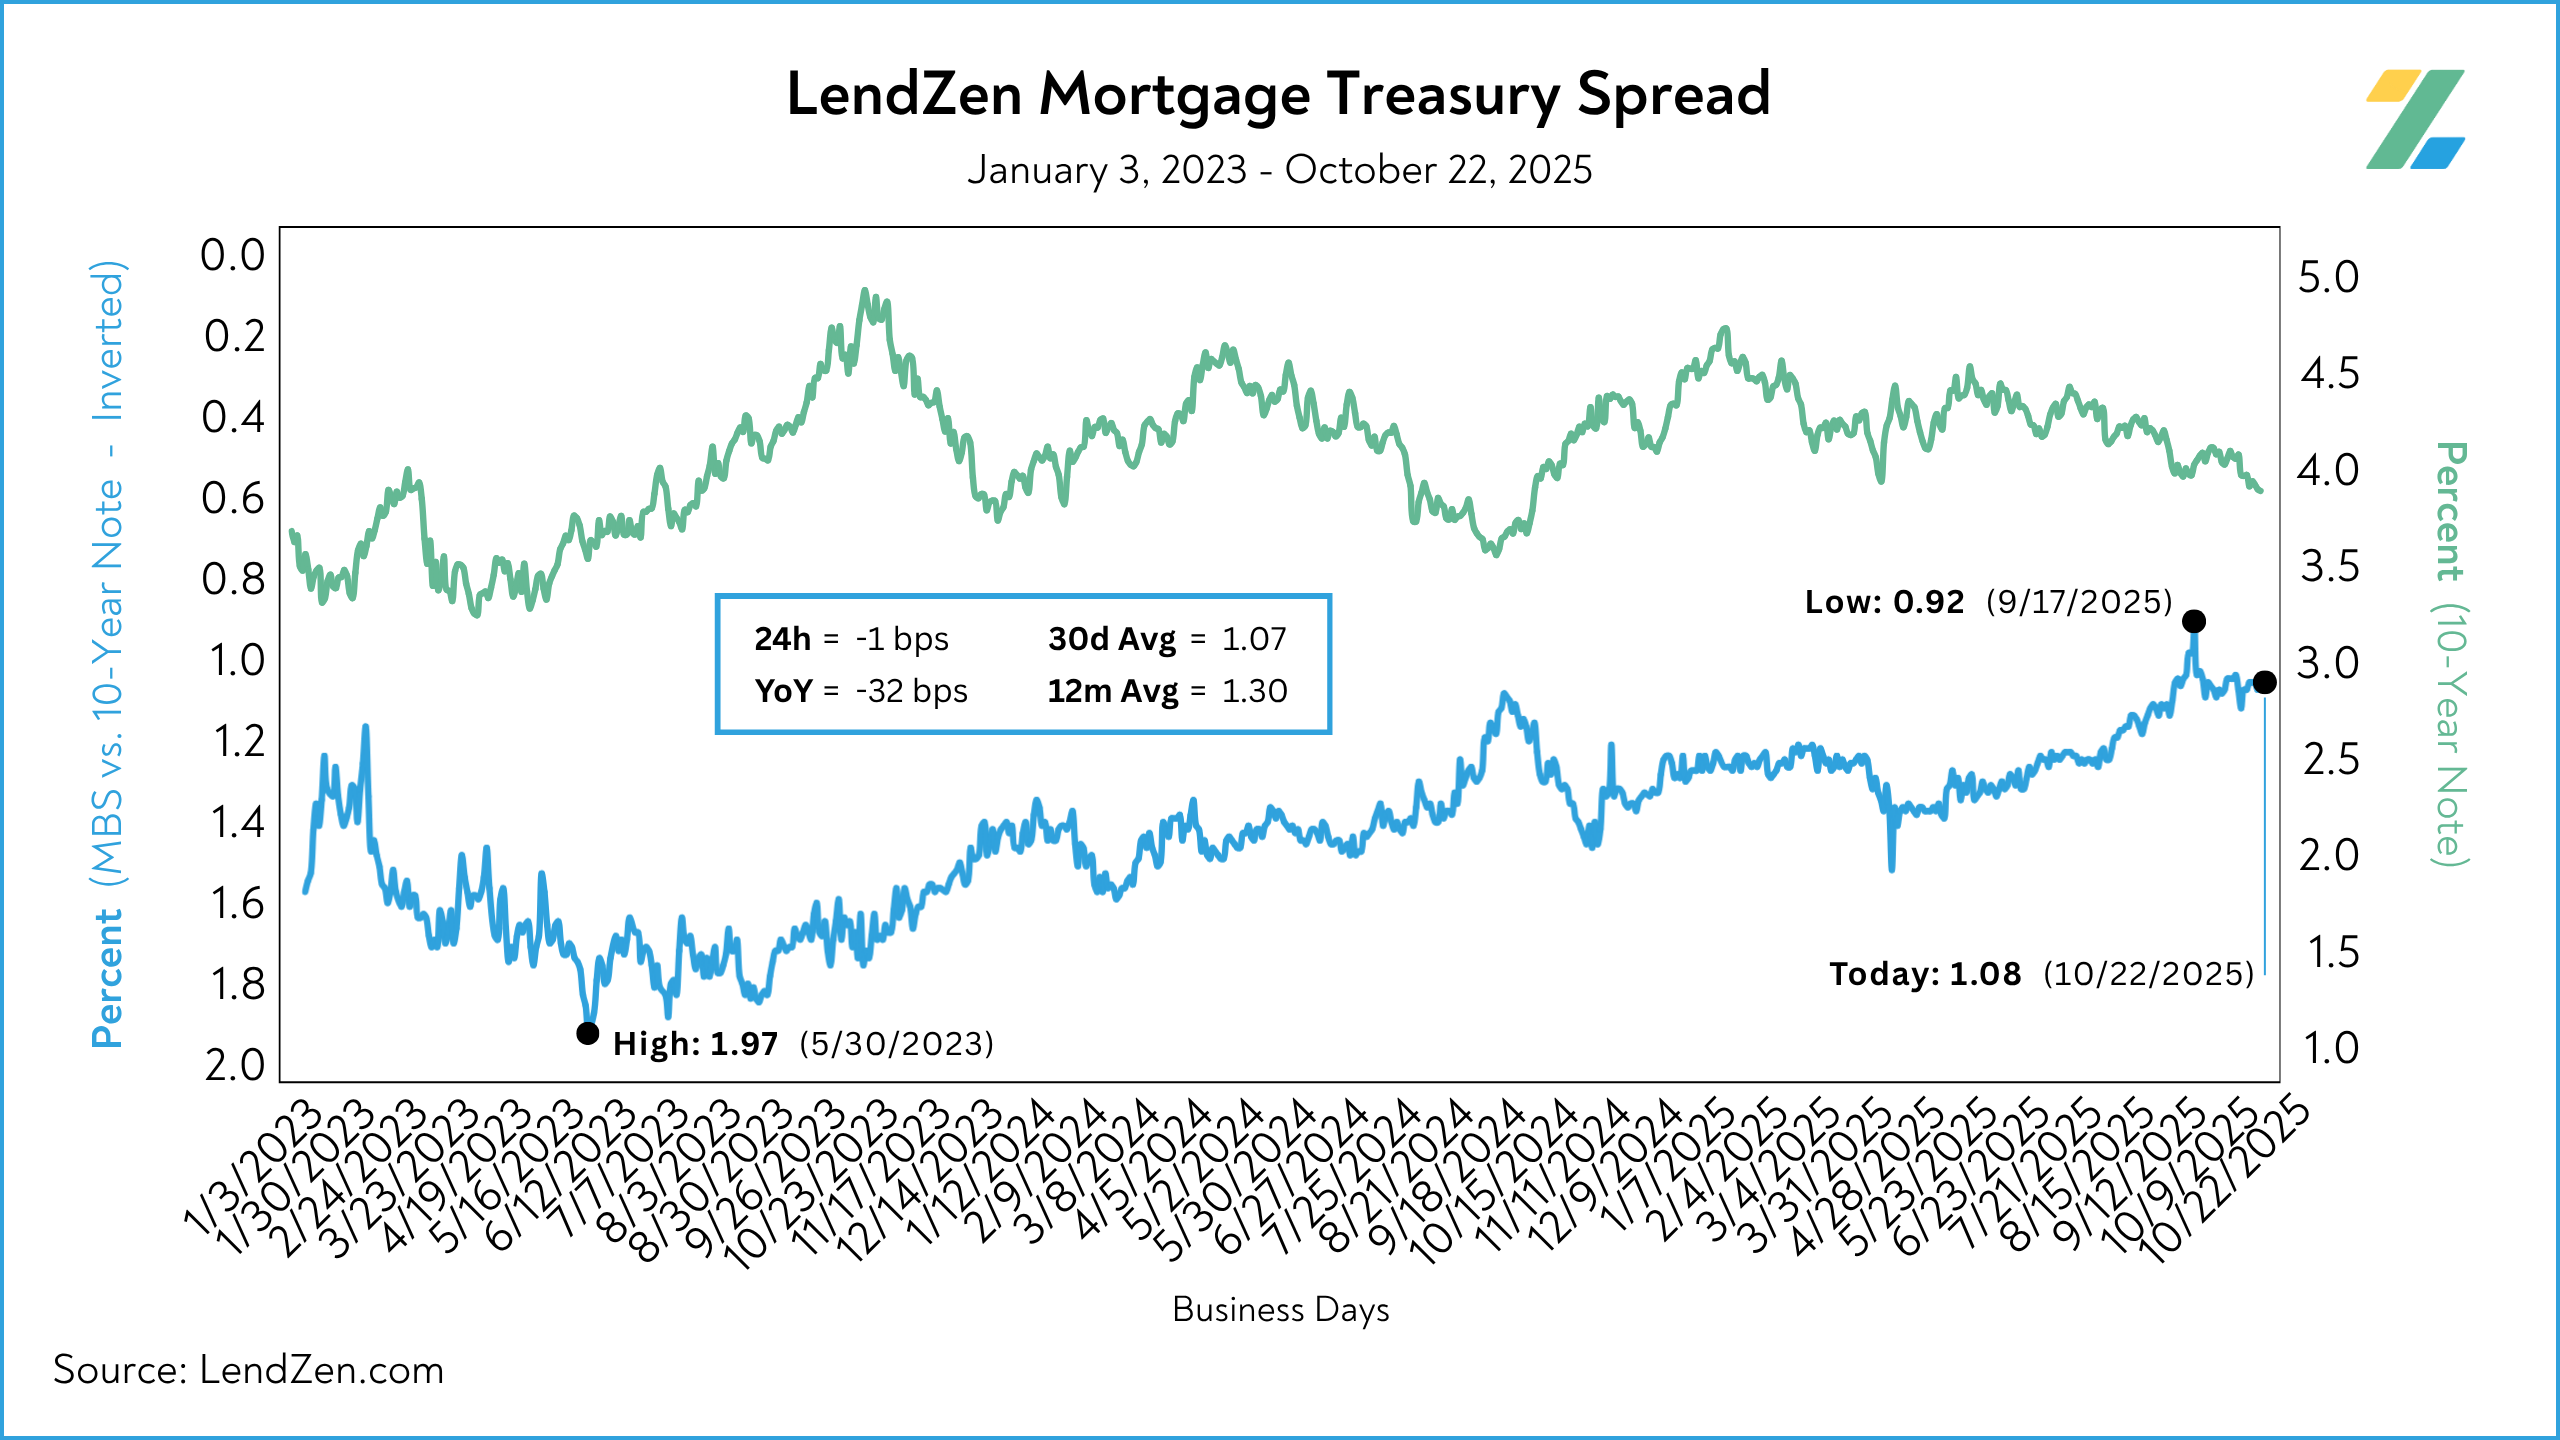
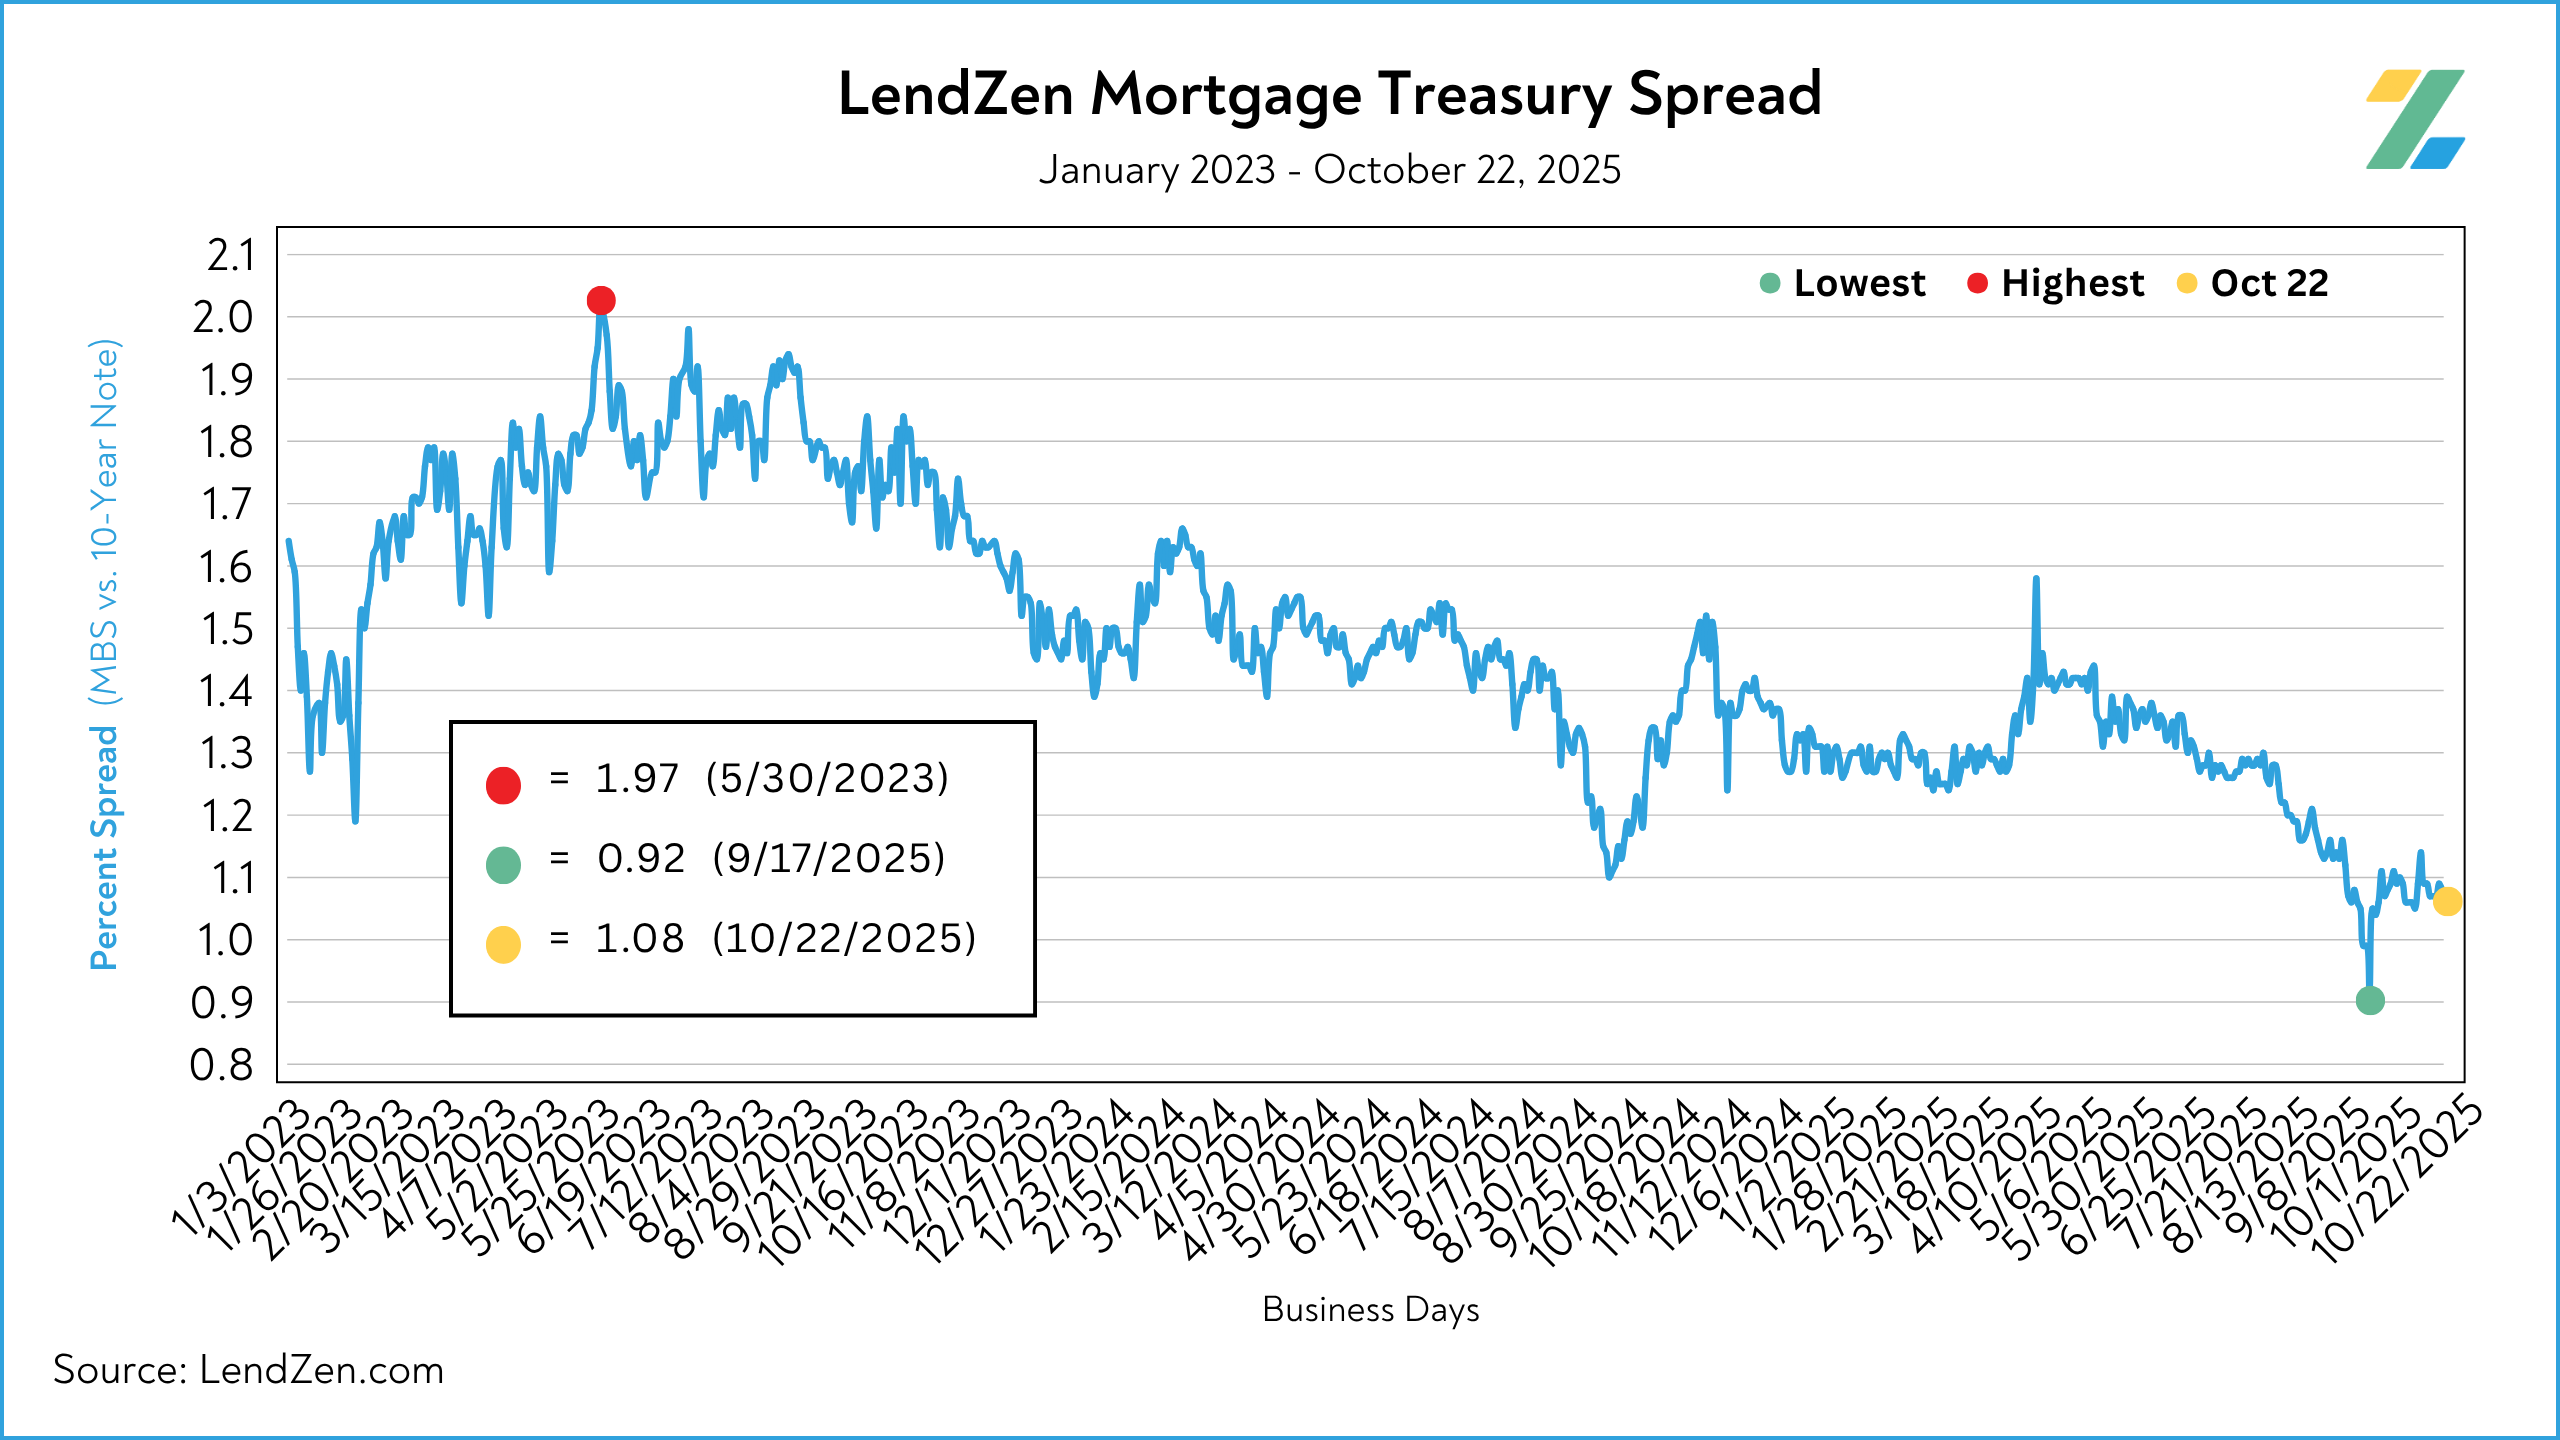
MORTGAGE SPREADS 🧈
-------------------------
Published daily with the LendZen Index is the LendZen Mortgage-Treasury Spread.
The LMTS uses actual bond yields to create a historically consistent, and reliable, data set.
Learn more about the importance of accurately calculating spreads on this Substack post.
The spread between mortgage bonds and the U.S. 10-Year tightened 2-bps during the short week, with no change on Friday.
However, with a decline of 29 bps since last year, spreads have been the real story behind mortgage rates now versus 2024.
Oct 14 = 1.09
Oct 17 = 1.07
30d Avg = 1.07
12m Avg = 1.30
YoY = - 29 bps (1.36)
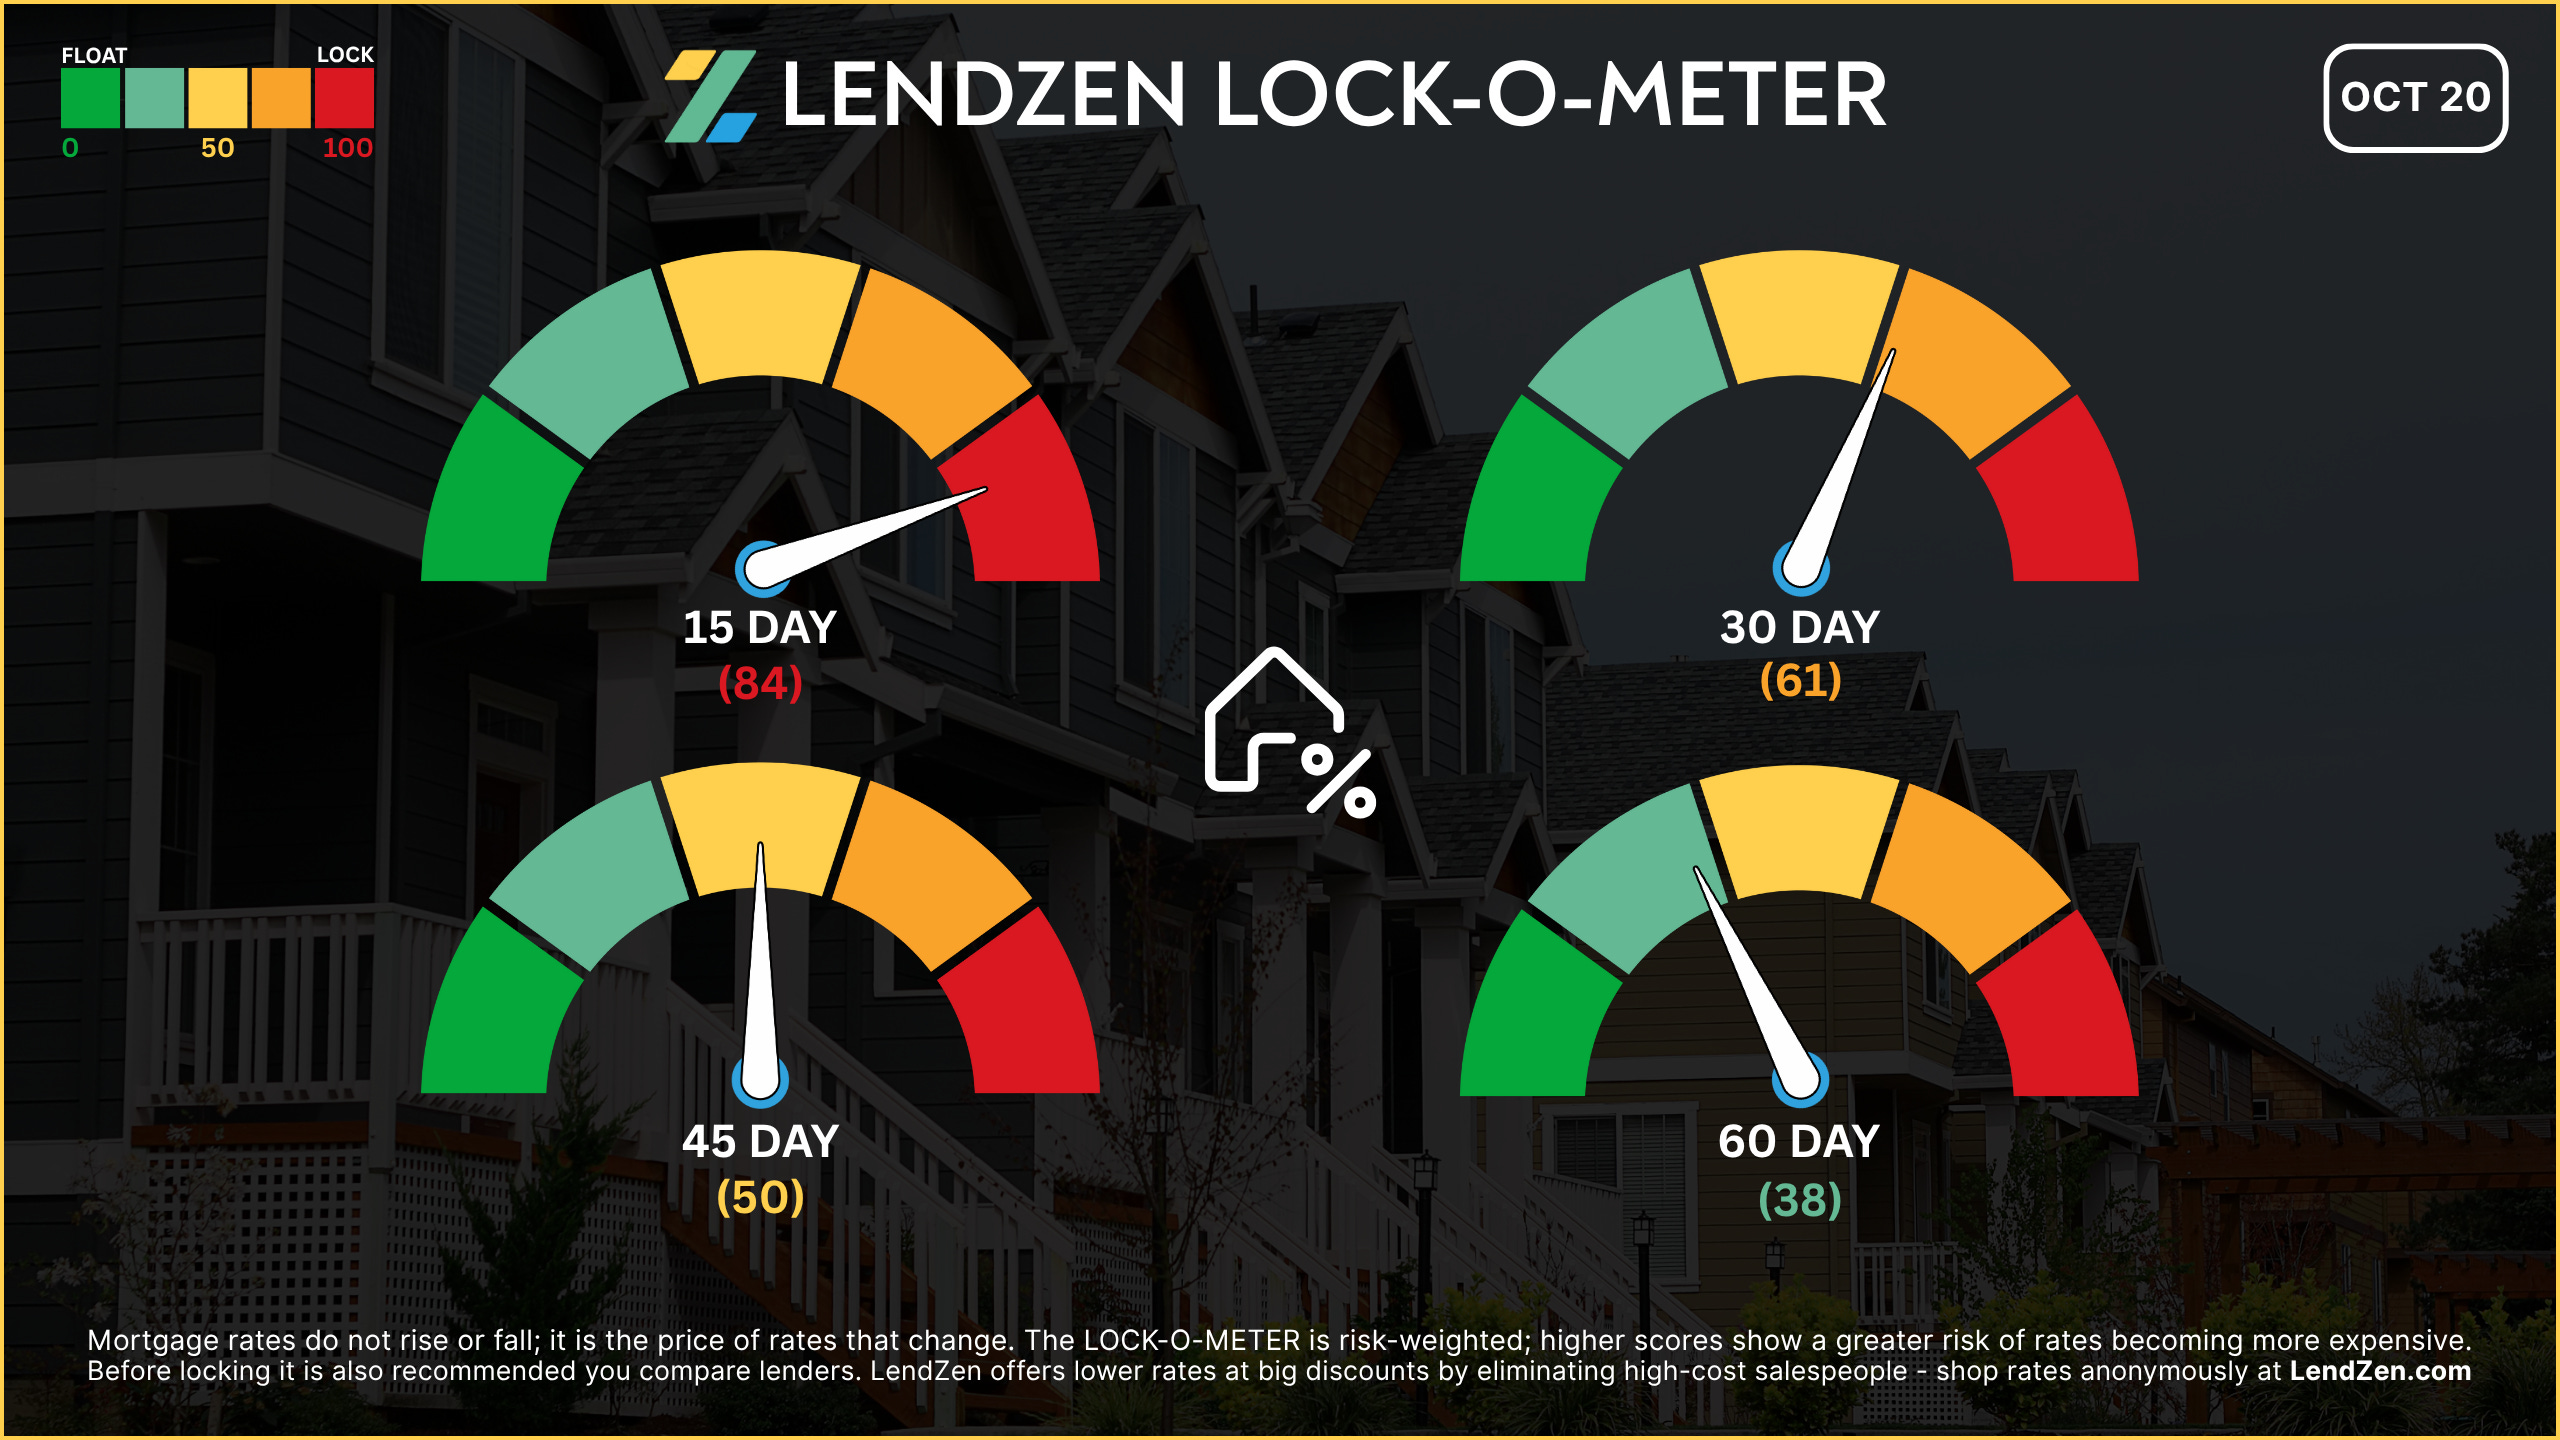
RATE LOCK GUIDE 🔒
---------------------
The LendZen LOCK-O-METER provides borrowers with a risk-weighted score based on how various macroeconomic events, including market data, central bank announcements, and geopolitics, each historically impacts the price of bonds.
higher risk scores = lean towards locking
------------------
Closing Window
------------------
[ 15 Days ] -- 84 🔴
Despite multiple bond-friendly events in recent weeks, there’s a heavy air of caution heading into CPI due to its outsized risk and late timing. The risk is asymmetric: a high CPI could erase critical gains for buyers needing to close.
[ 30 Days ] -- 61 🟠
Even with strong MBS gains in the rearview, shutdown delays and data bottlenecks cloud visibility. Meanwhile, Friday’s CPI release is make-or-break for any 30-day float scenario. Until that lands, markets remain in a fragile repricing window, not yet confident in a sustainable bond rally.
[ 45 Days ] -- 50 🟡
A deeper view shows room for optimism if Friday’s CPI confirms disinflation, along with November data. But the bias towards floating is conditional, especially as bond market reactions to Fed rate cuts are unpredictable.
[ 60 Days ] -- 38 🟢
While gold’s rise may divert traditional safe-haven inflows away from bonds, a Q4 economic slowdown, combined with the possibility of multiple Fed rate cuts, keeps longer-term float bias intact. With one of the lowest lock scores of the year, there is long term hope for a new bull market in bonds.
If you are already in a strong position, locking makes the most sense since the focus should be on making a savvy rate choice based on your longer-term rate outlook.
I expand on this “long game” approach in this Substack article.
Thanks for reading.
If you are interested in more mortgage insights, then I suggest checking out this recent Substack article.
