
Mortgage Rate Data Deluge 🏠📉🔒 (NOV 24)
Here is a deluge of mortgage rate data to start your week!

Included in this week’s deluge are the following sections:
MARKET RECAP ⏪
--------------------
With the government shutdown behind us, and the December rate cut “not a foregone conclusion”, markets hoped the backlog of economic data could tip the scales in one direction.
Unfortunately, the September Non-Farm Payroll employment report that was released Thursday (originally scheduled for October 3) gave mixed signals.
All together it did little to quench the thirst for clarity.
In the end last week was again sideways, which has been the story thus far in November.
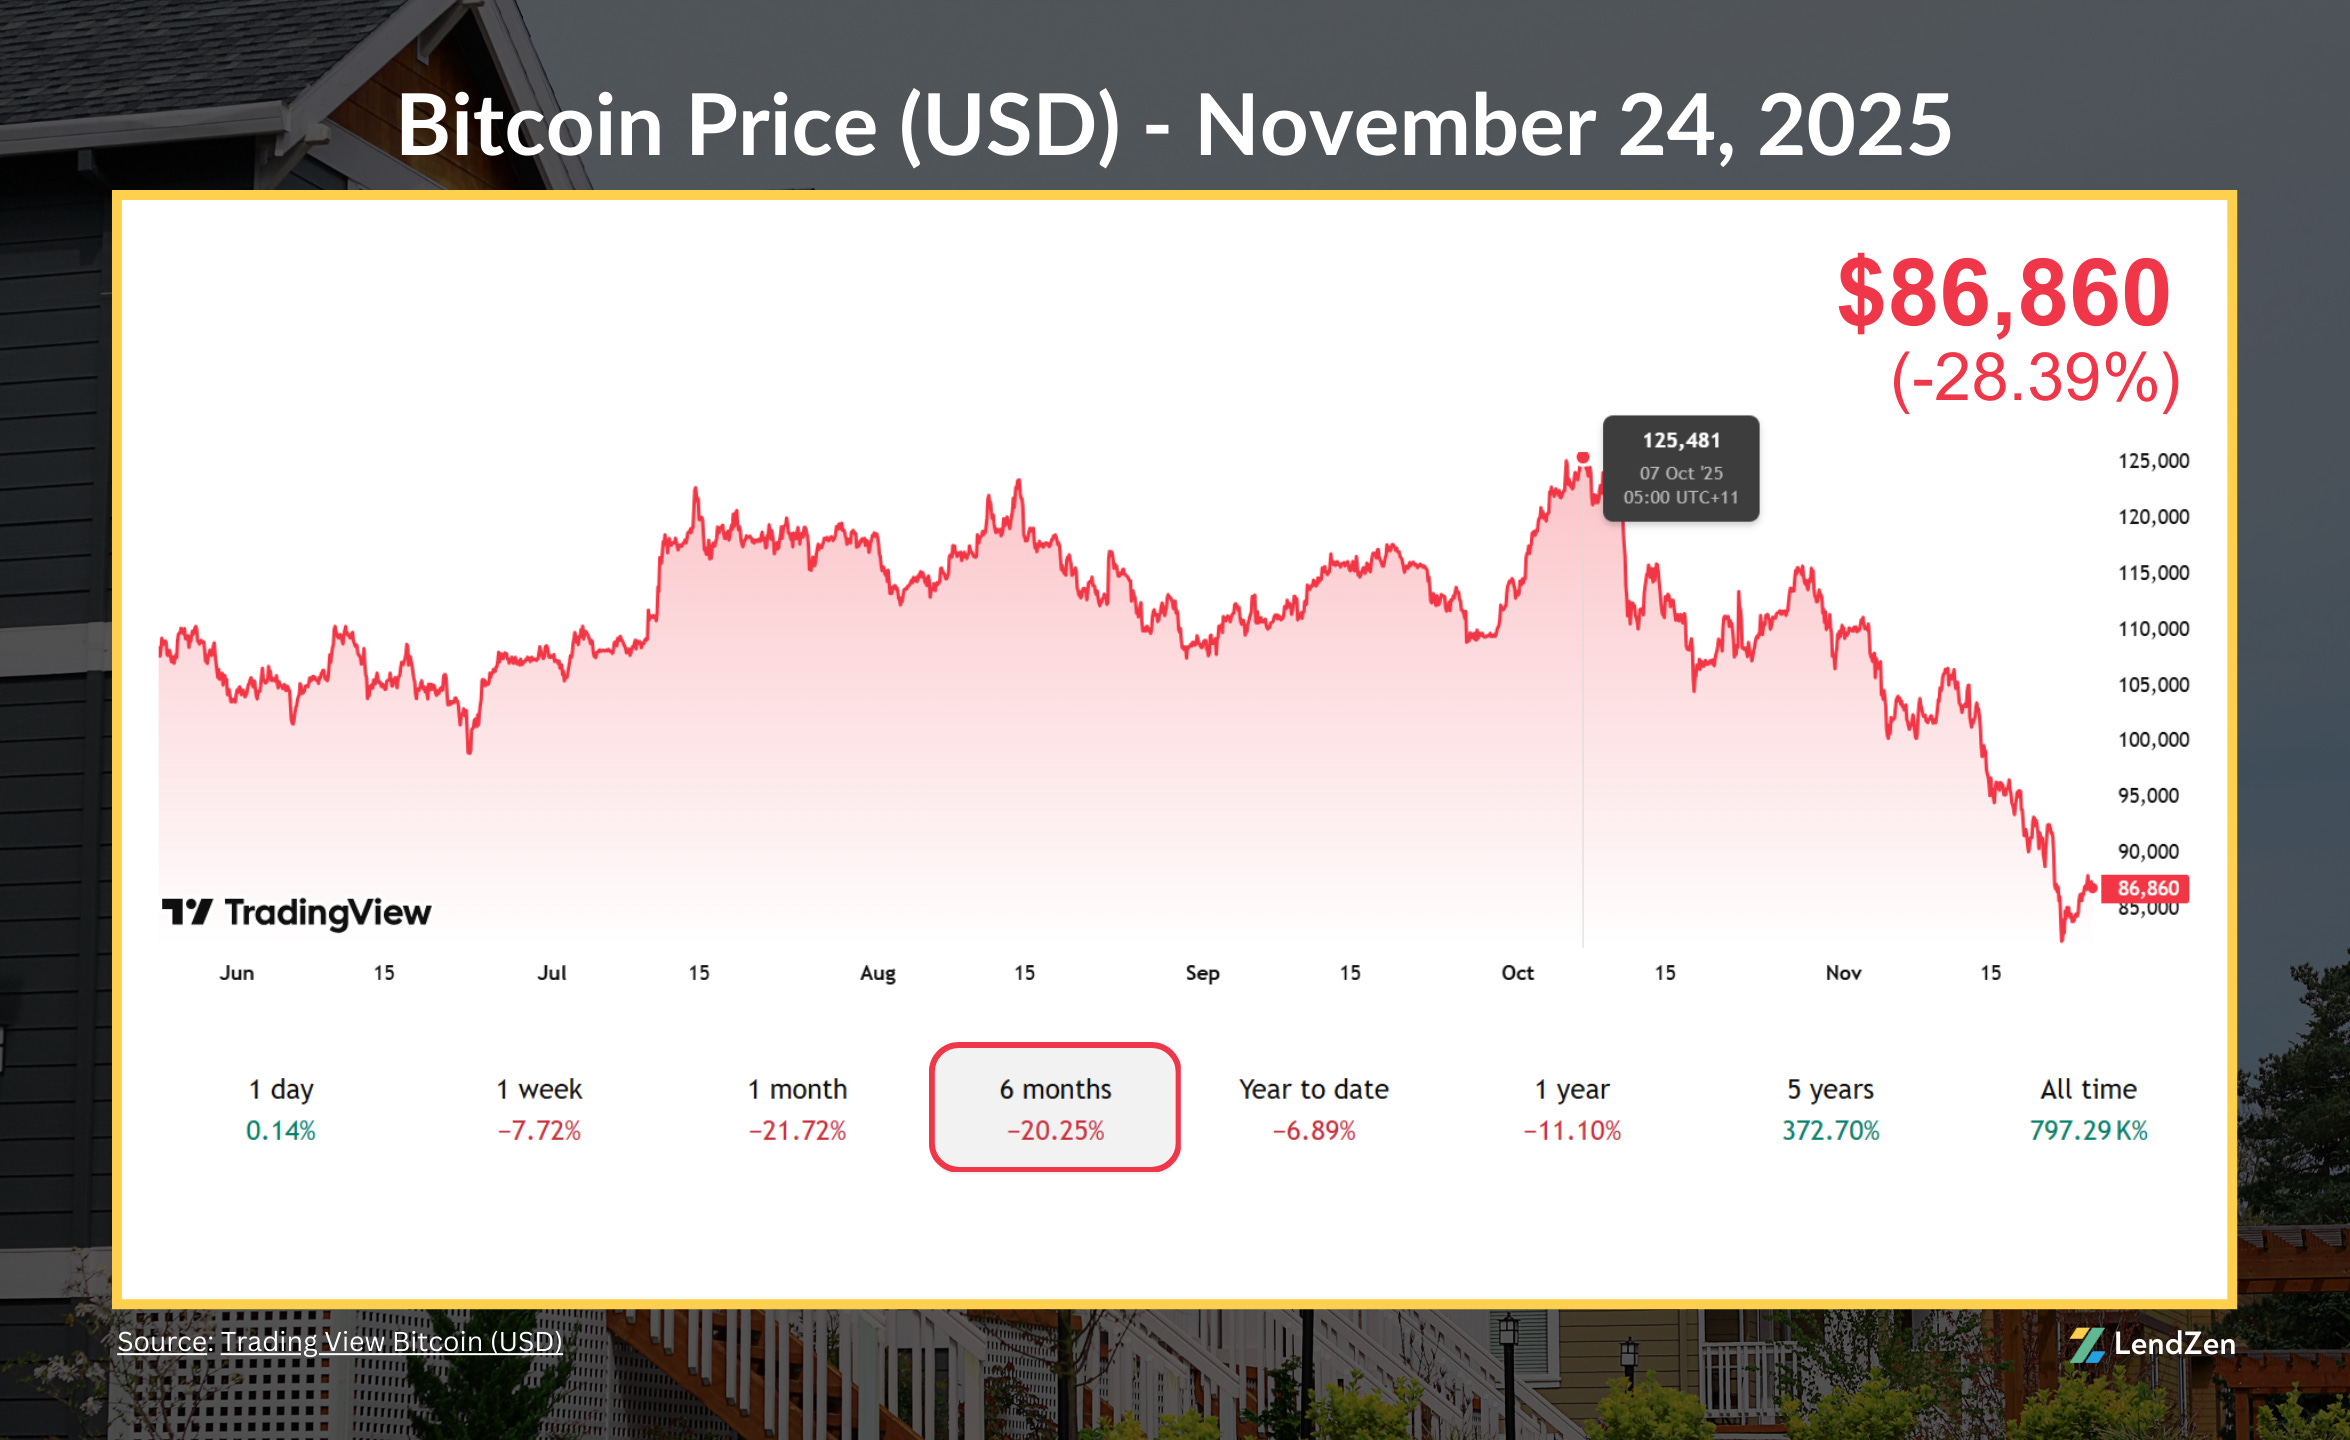
BITCOIN BEATDOWN 🥊
-------------------------
The beatdown for Bitcoin and its crypto brethren continues.
The digital darling (BTC) is down almost 30% ($35k) from the all-time highs of $125k in October.
Crypto markets have become a barometer for investor risk appetite and market liquidity.
Big moves down like this matter to mortgage rates because they could be an early sign that sentiment is shifting more towards “risk off”, which favors higher bond prices.
MORTGAGE RATE PRICES 📉
--------------------------------
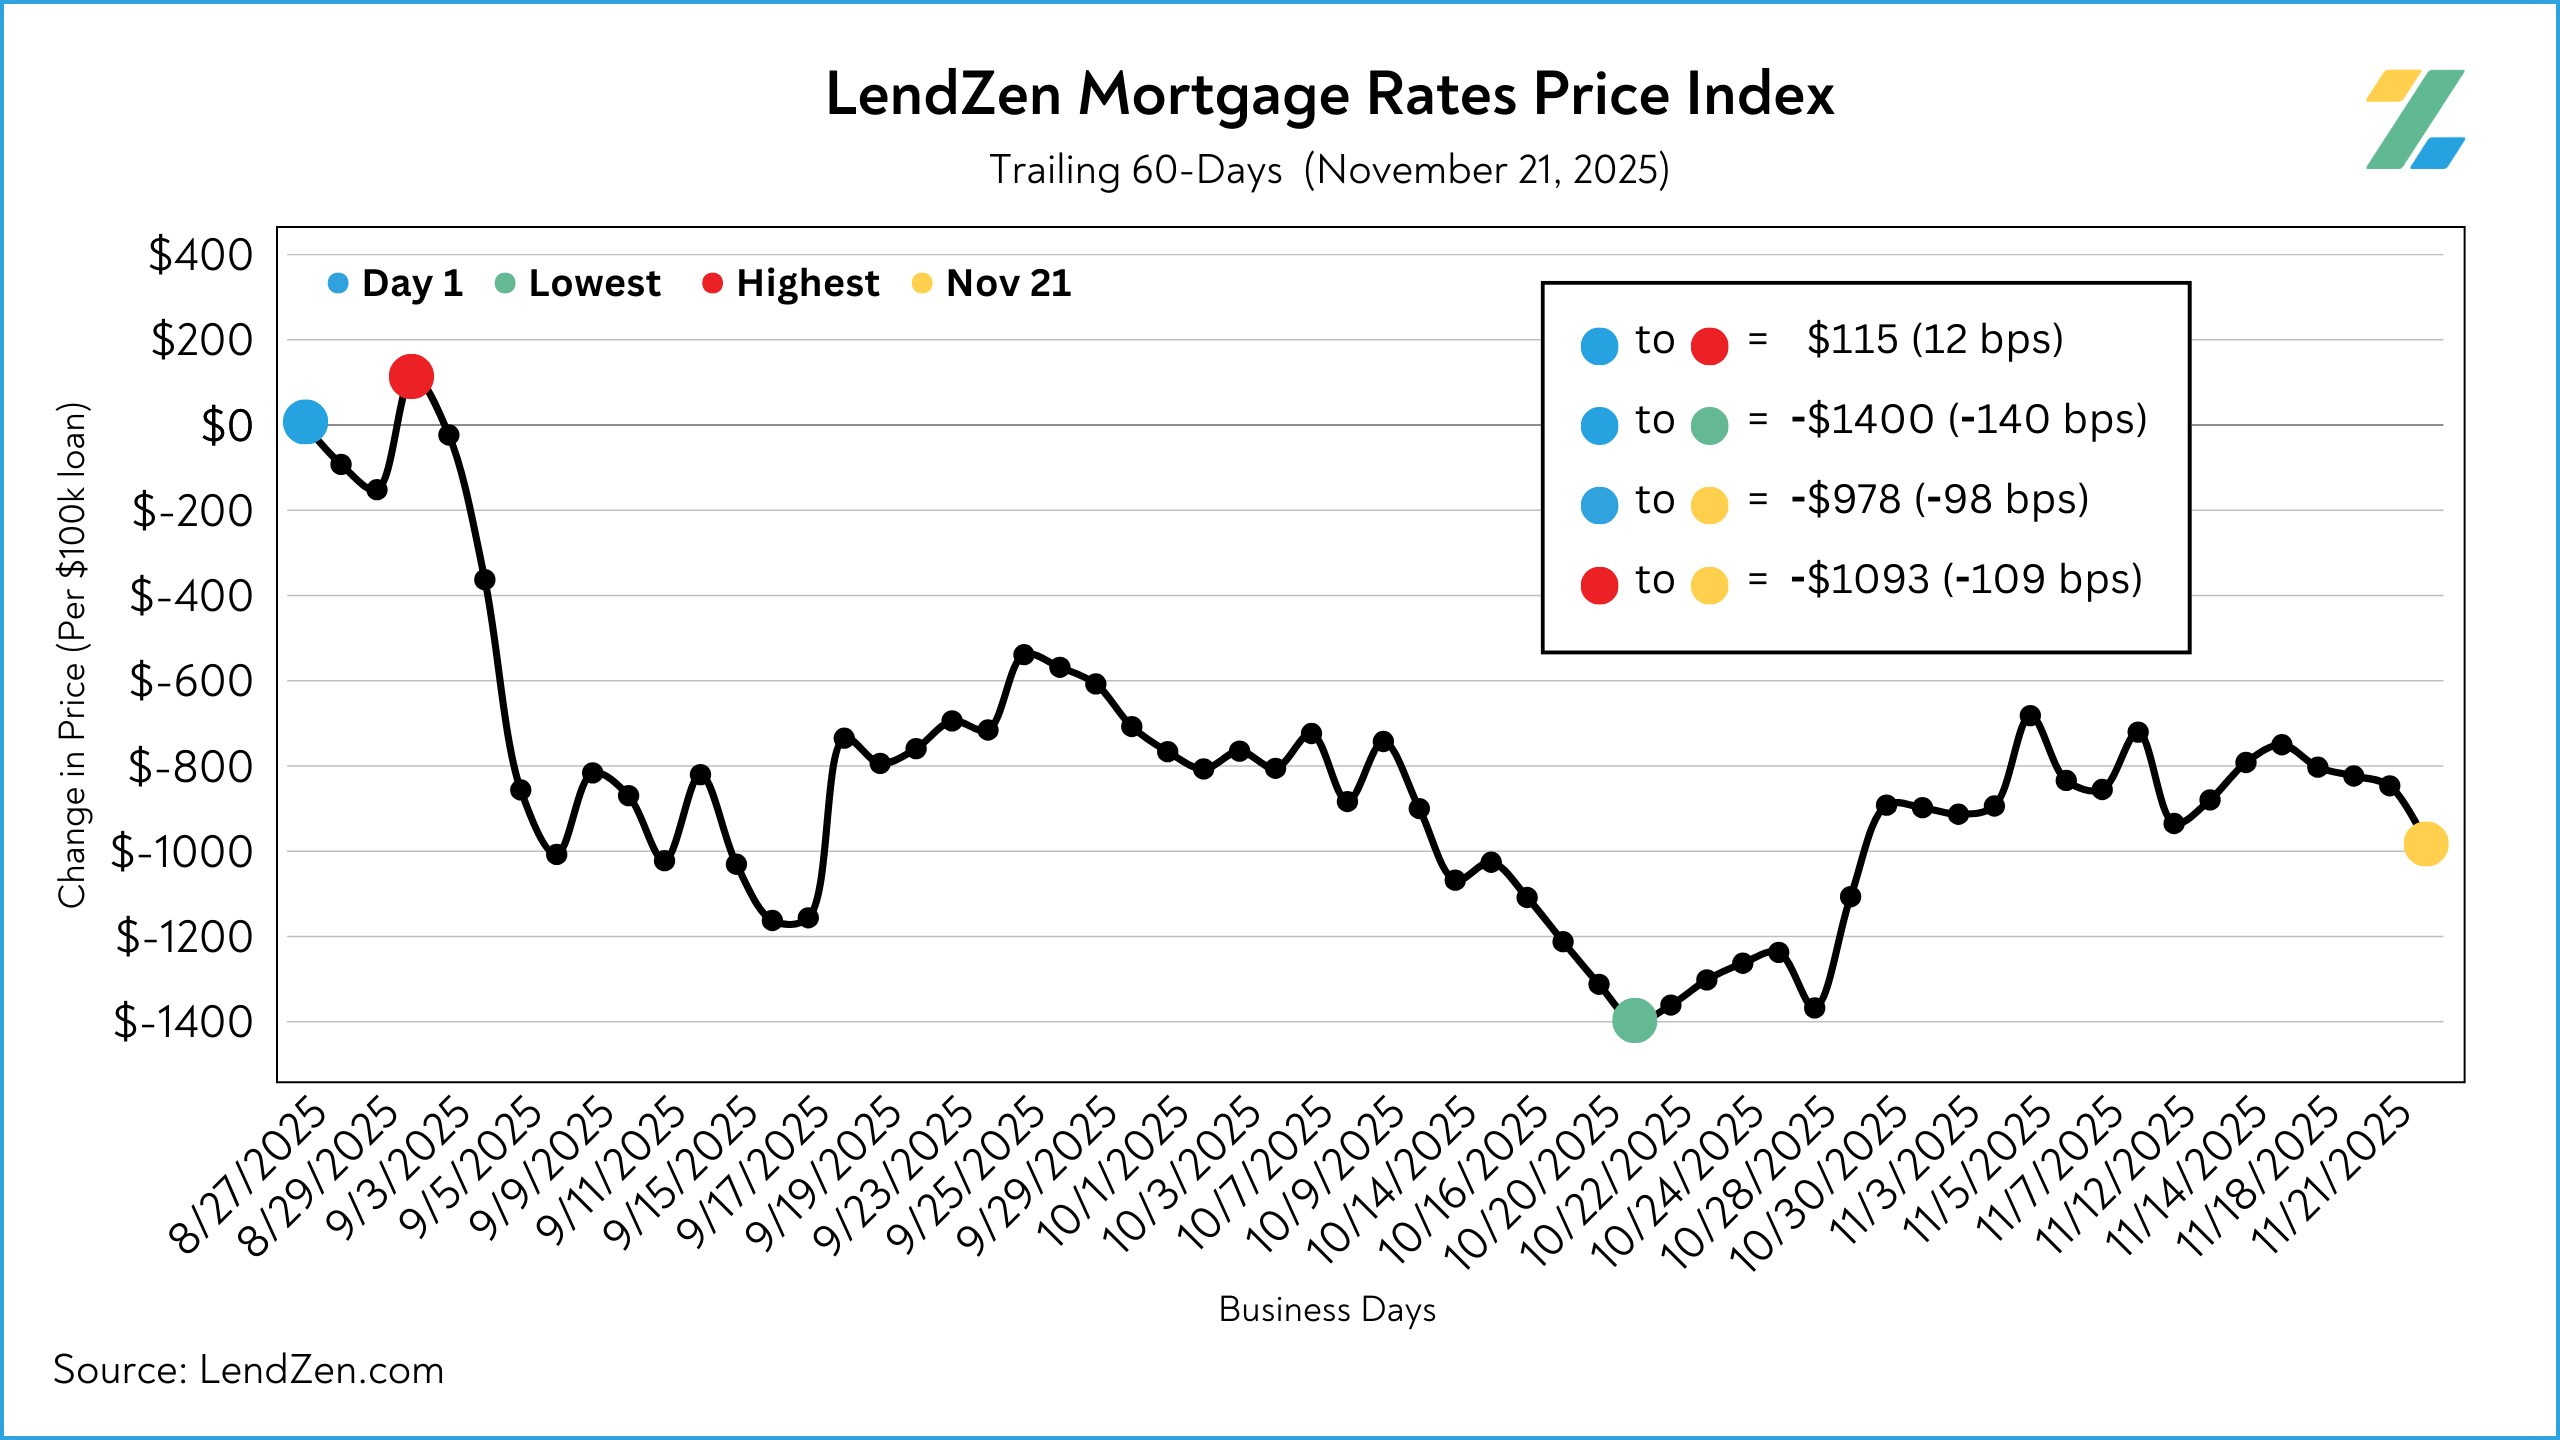
Mortgage rates do not rise or fall, instead the PRICE of rates change.
The LendZen Index calculates a daily change in the price of mortgage rates by tracking a spectrum of mortgage-backed securities (MBS).
This provides borrowers with a more specific measurement of how the cost to obtain a mortgage is changing, regardless of the lender, rate, or credit score.
-----------
11/21/2025
-----------
24-Hour: -13 bps (-$131 per $100K)
5-Day: -23 bps (-$228)
10-Day: -12 bps (-$123)
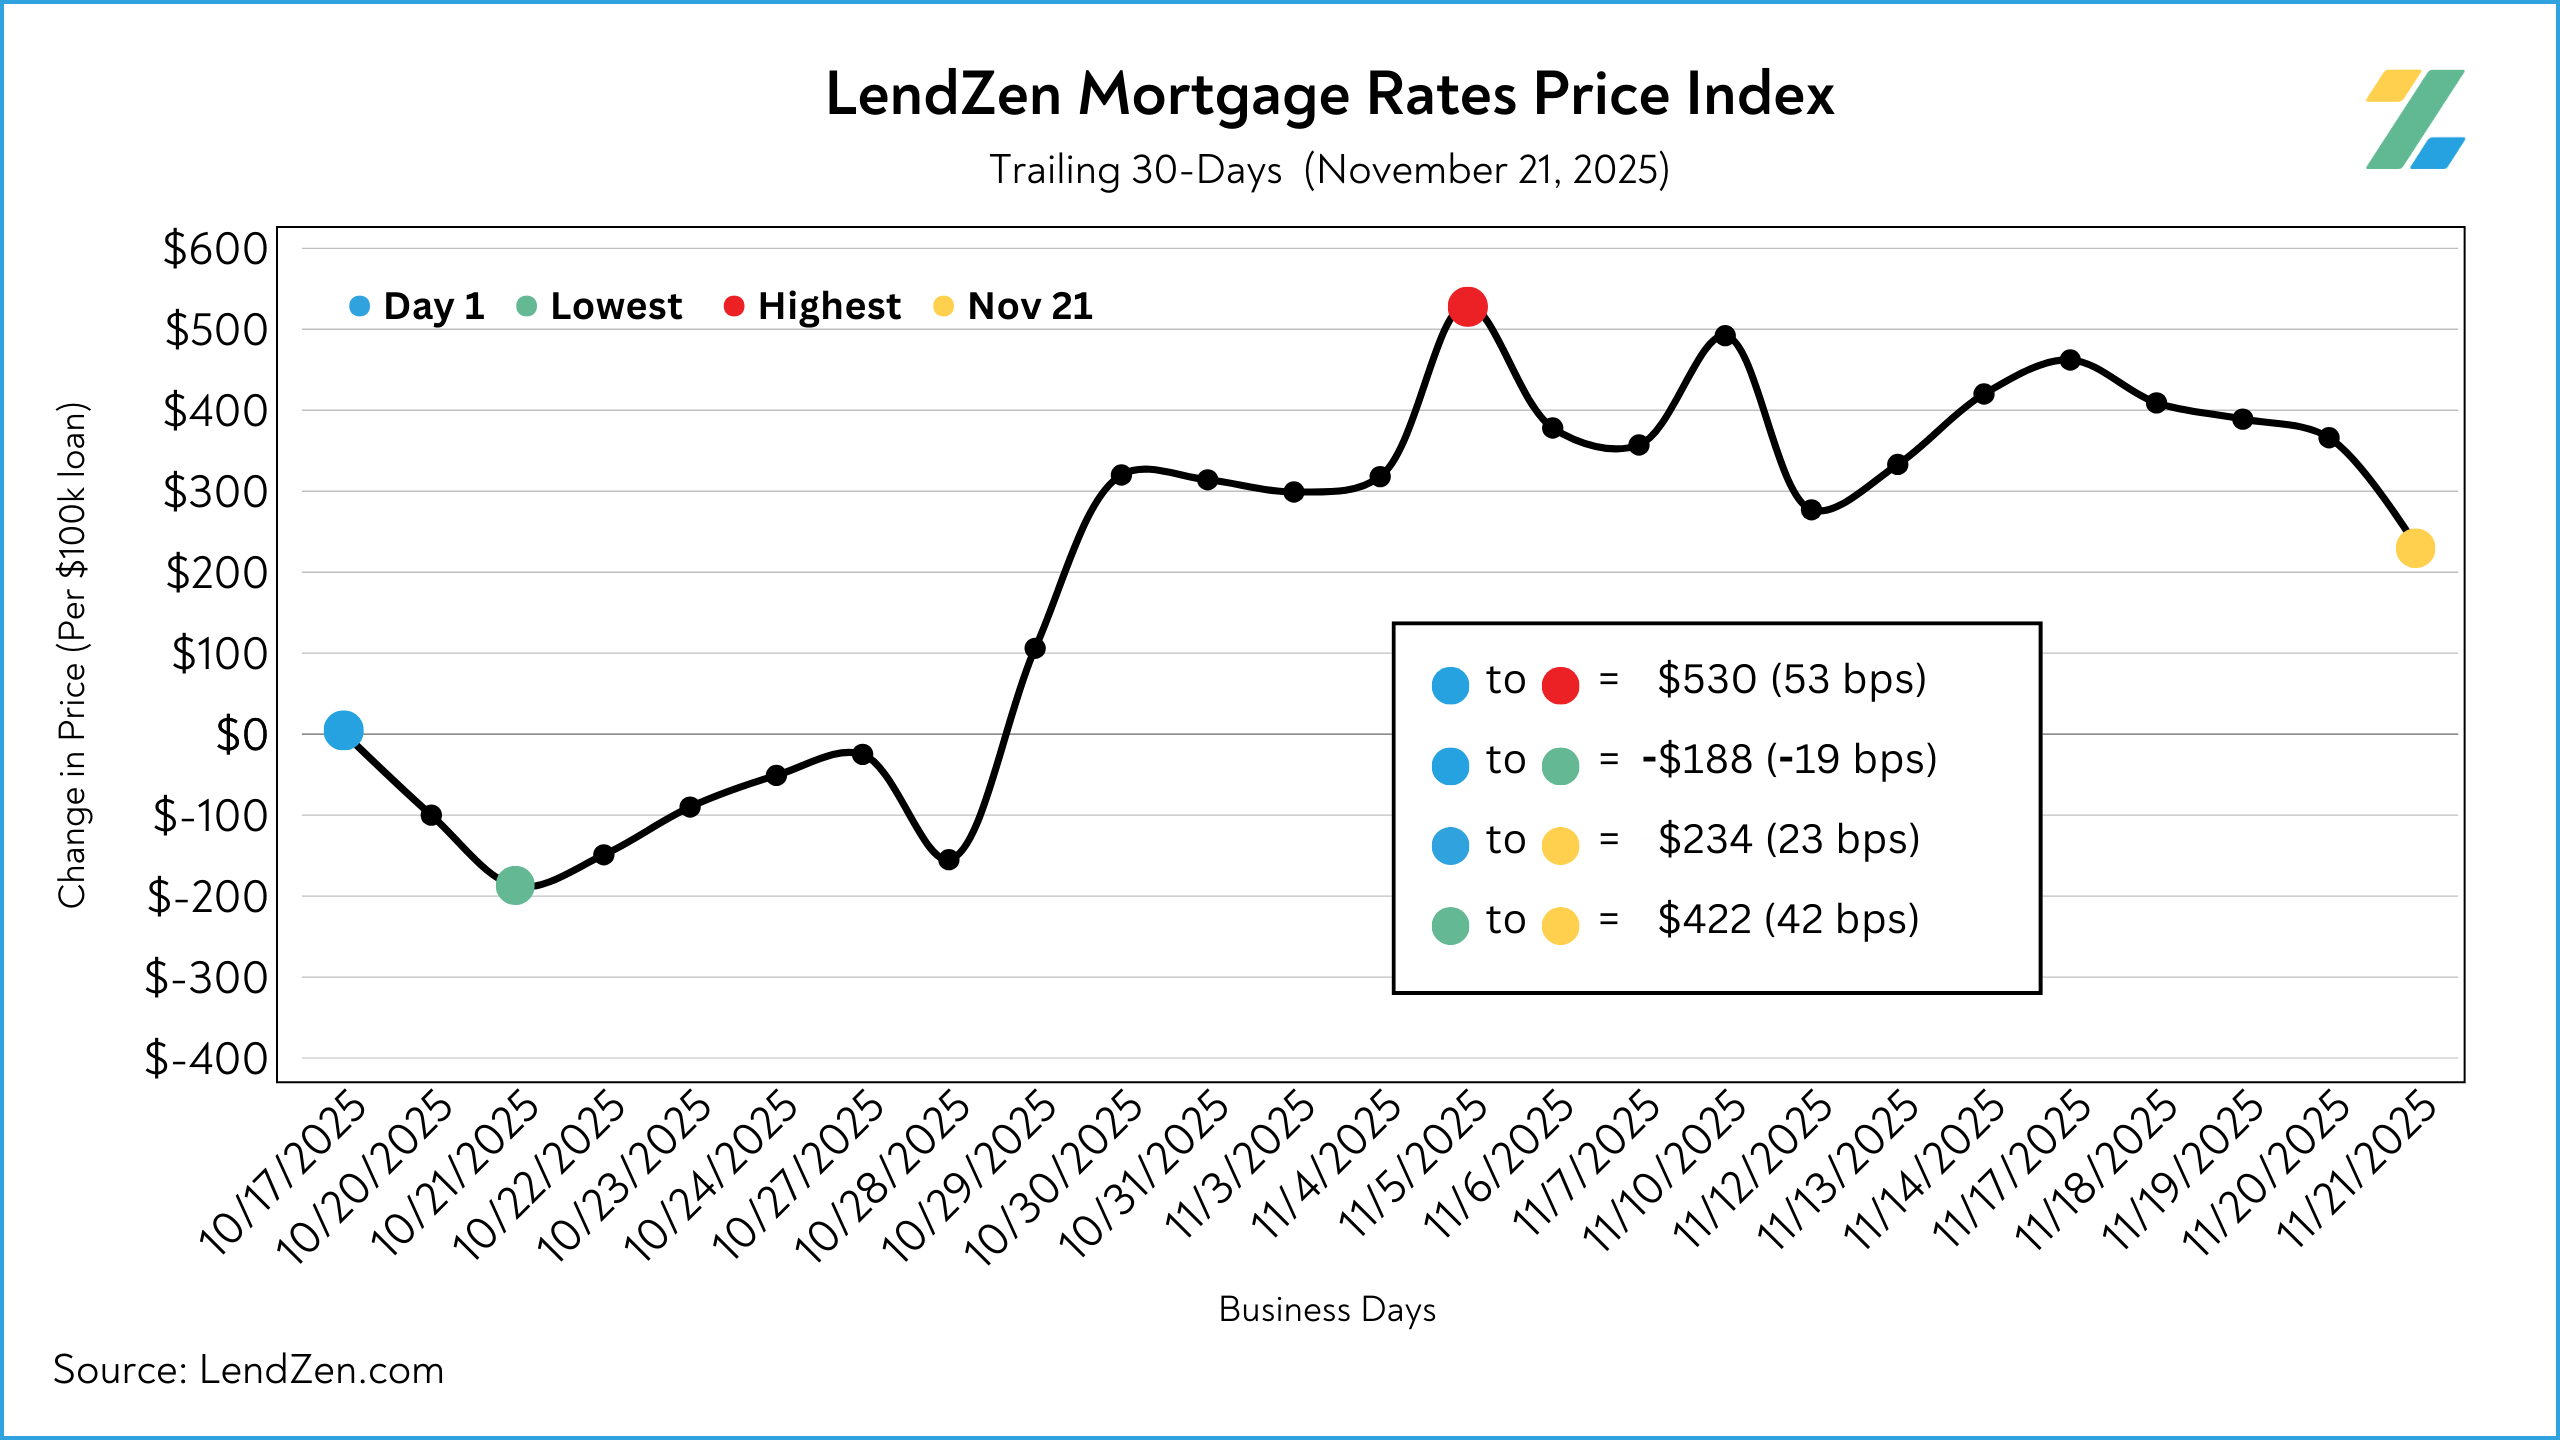
30-Day: -24 bps (-$235)
60-Day: -98 bps (-$978)
It’s been a sideways dance as bonds wait for guidance from econ data or the Fed.
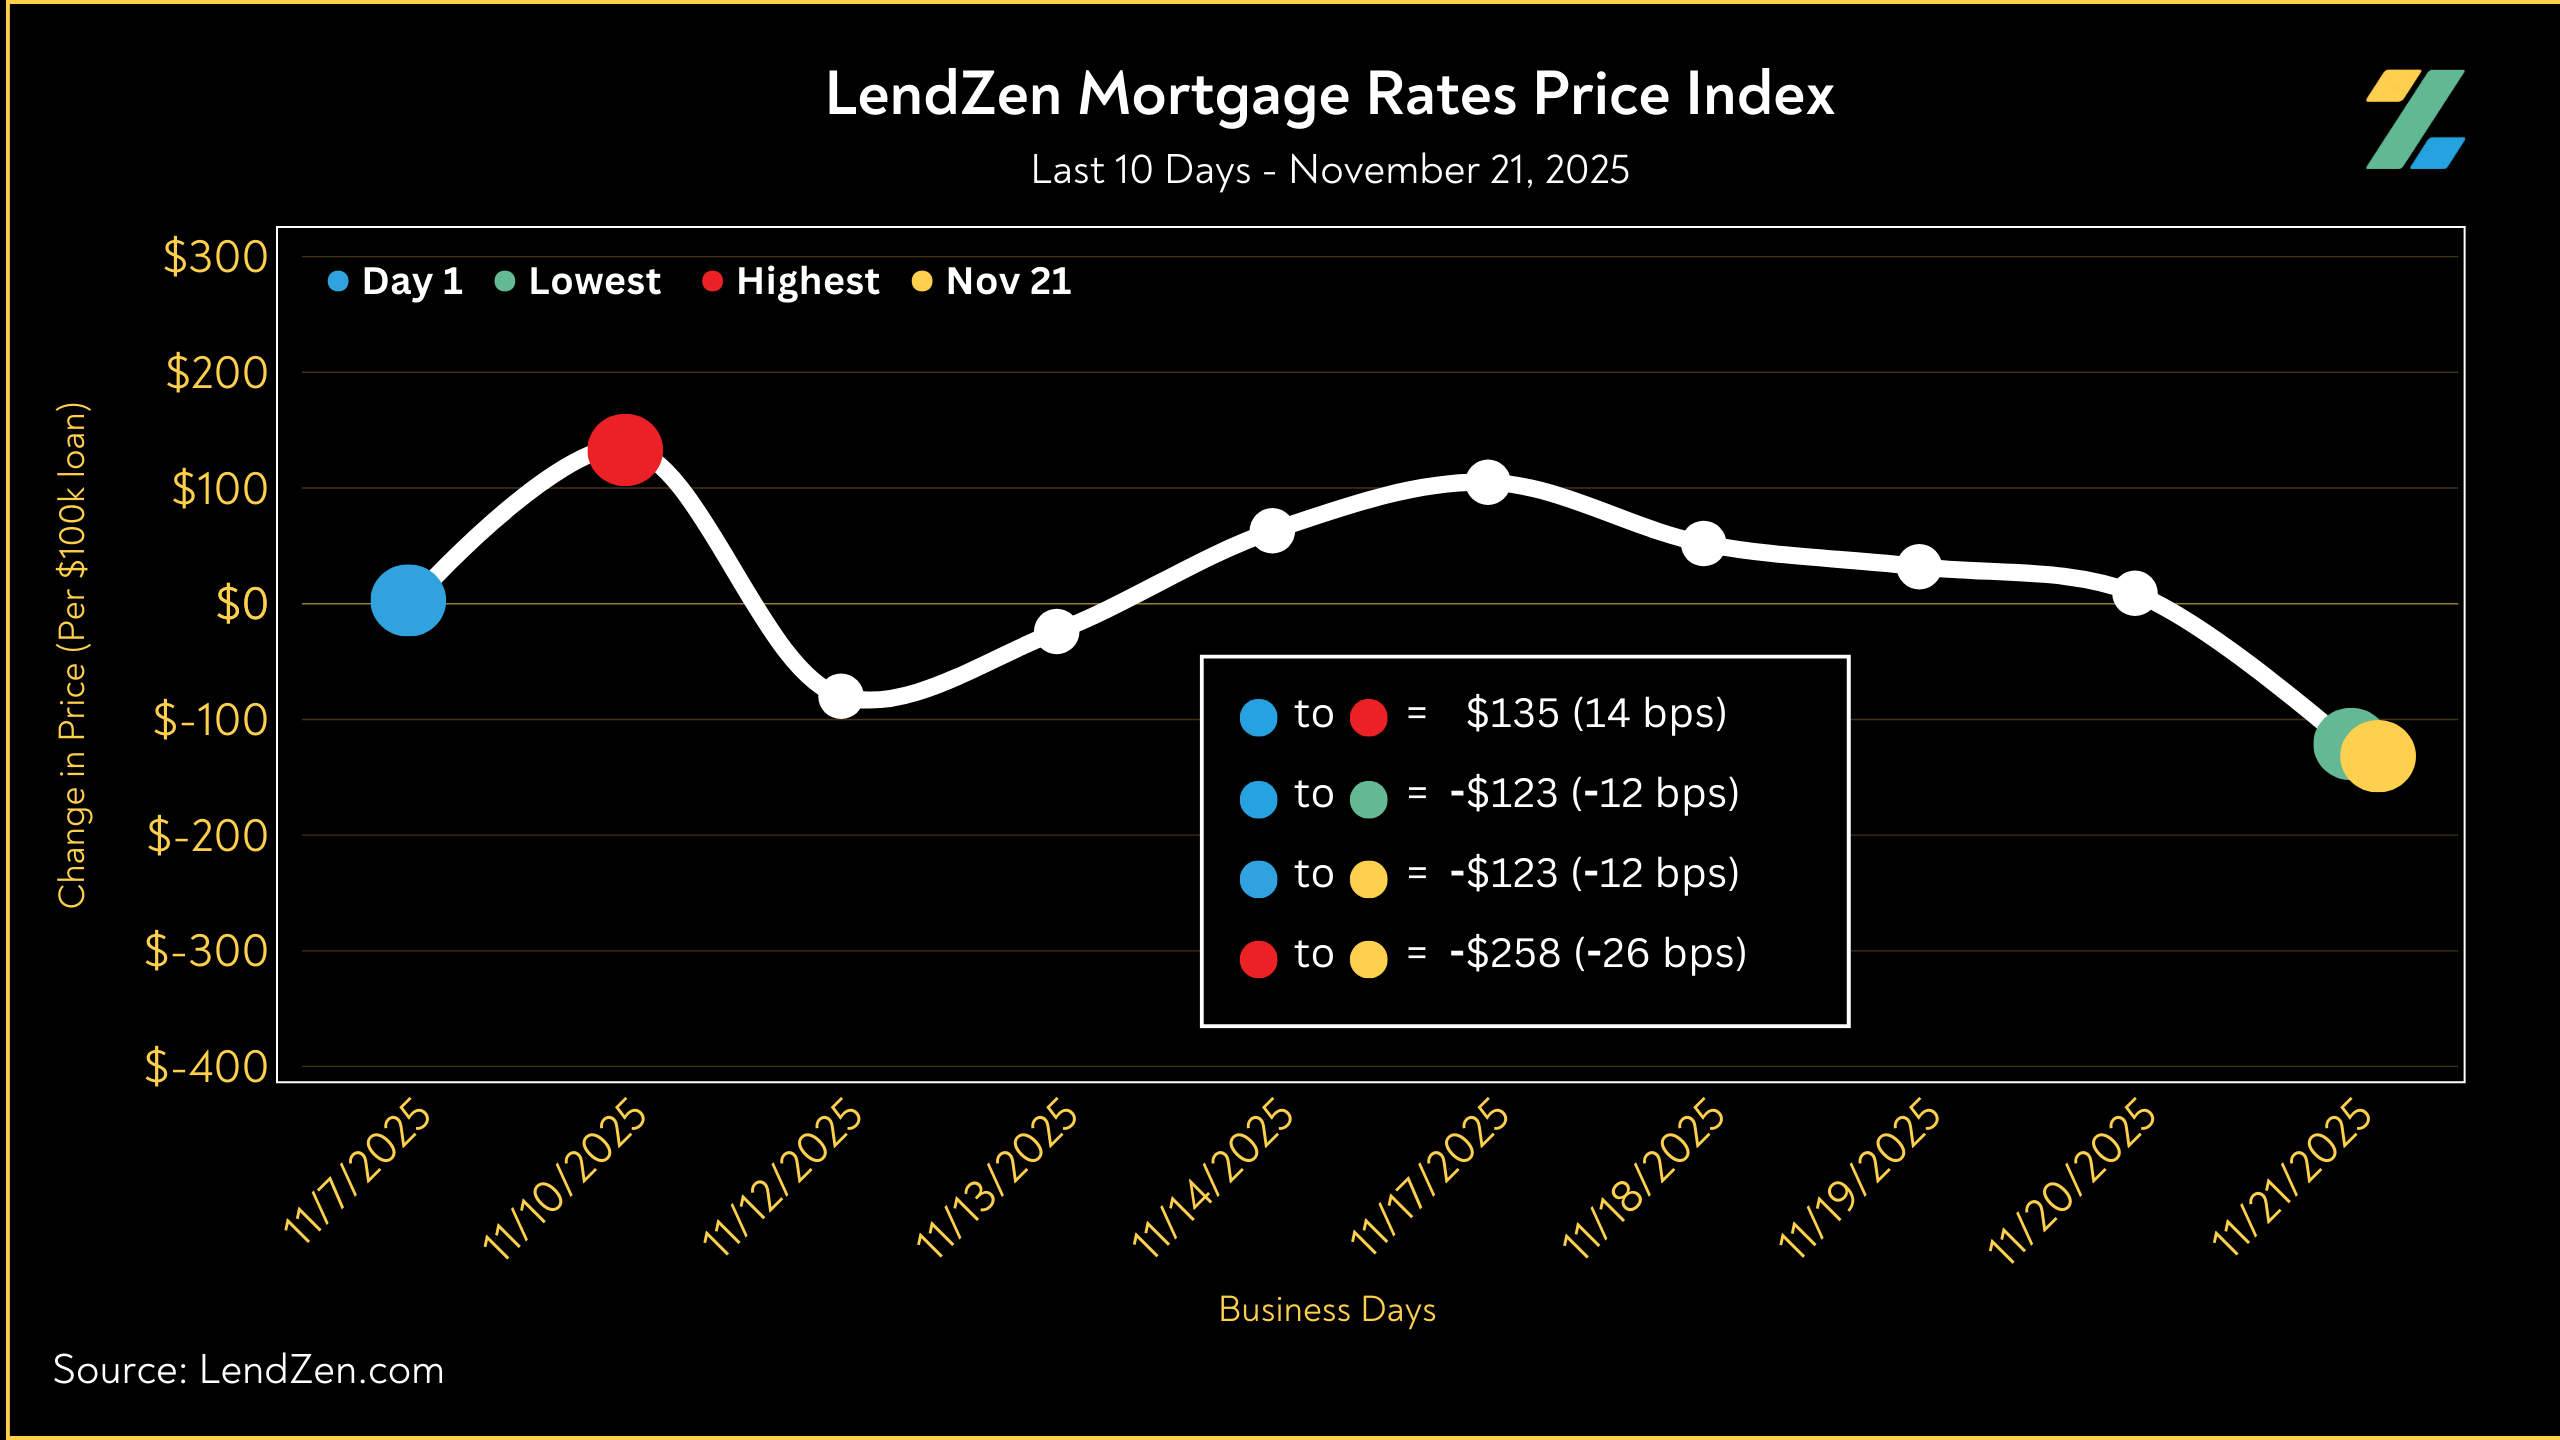
Mortgage rate prices have been in a range of 50 – 70 bps above the October 21 multi-year low.
Although some of the selling pressure subsided, mortgage rates still remain vulnerable hovering near the base of August’s post-NFP rally.
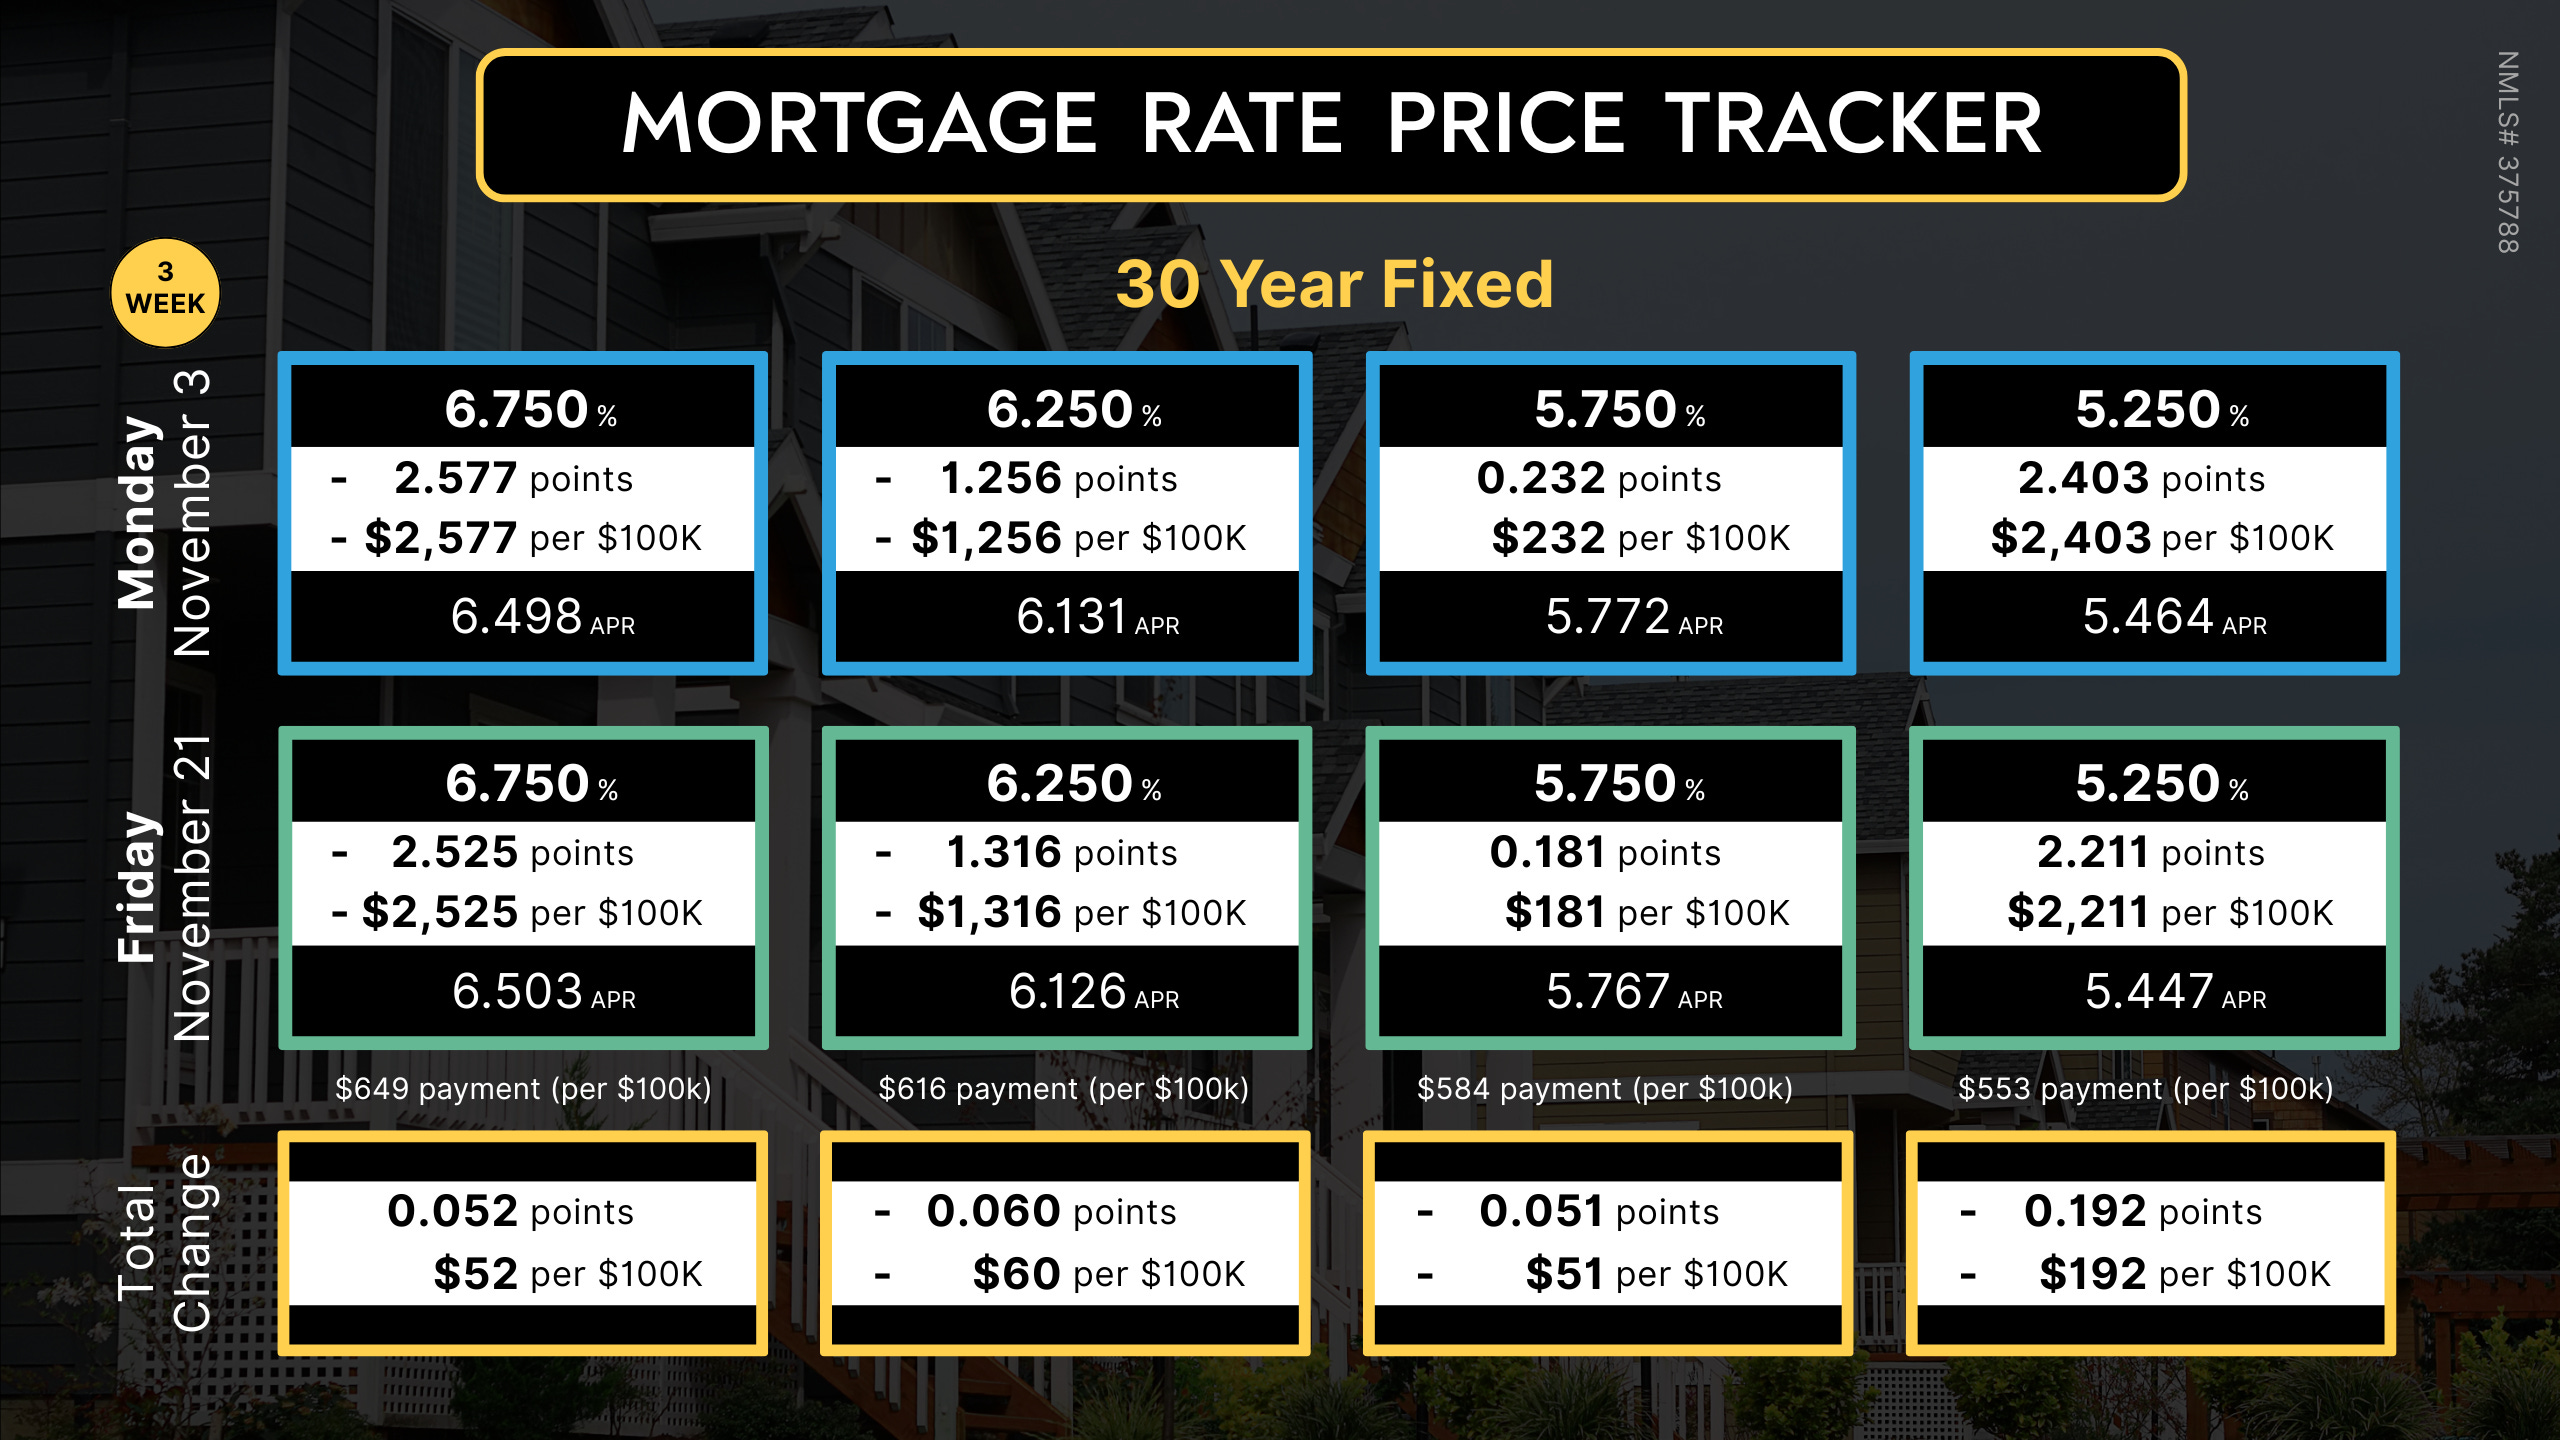
The LendZen Index monitors the change in price across a broad set of rates and mortgage bond coupons, whereas the LendZen Mortgage Rate Price Tracker is more “rate and loan program” specific.
Both are an example of how mortgage rates do not rise or fall, but instead it is their price that changes.
Since the LendZen Index has a variety of time series, the MRPT focuses on the current month’s activity.
You can explore the full results from November Week 3 on this Substack post.
MORTGAGE SPREADS 🧈
----------------------------
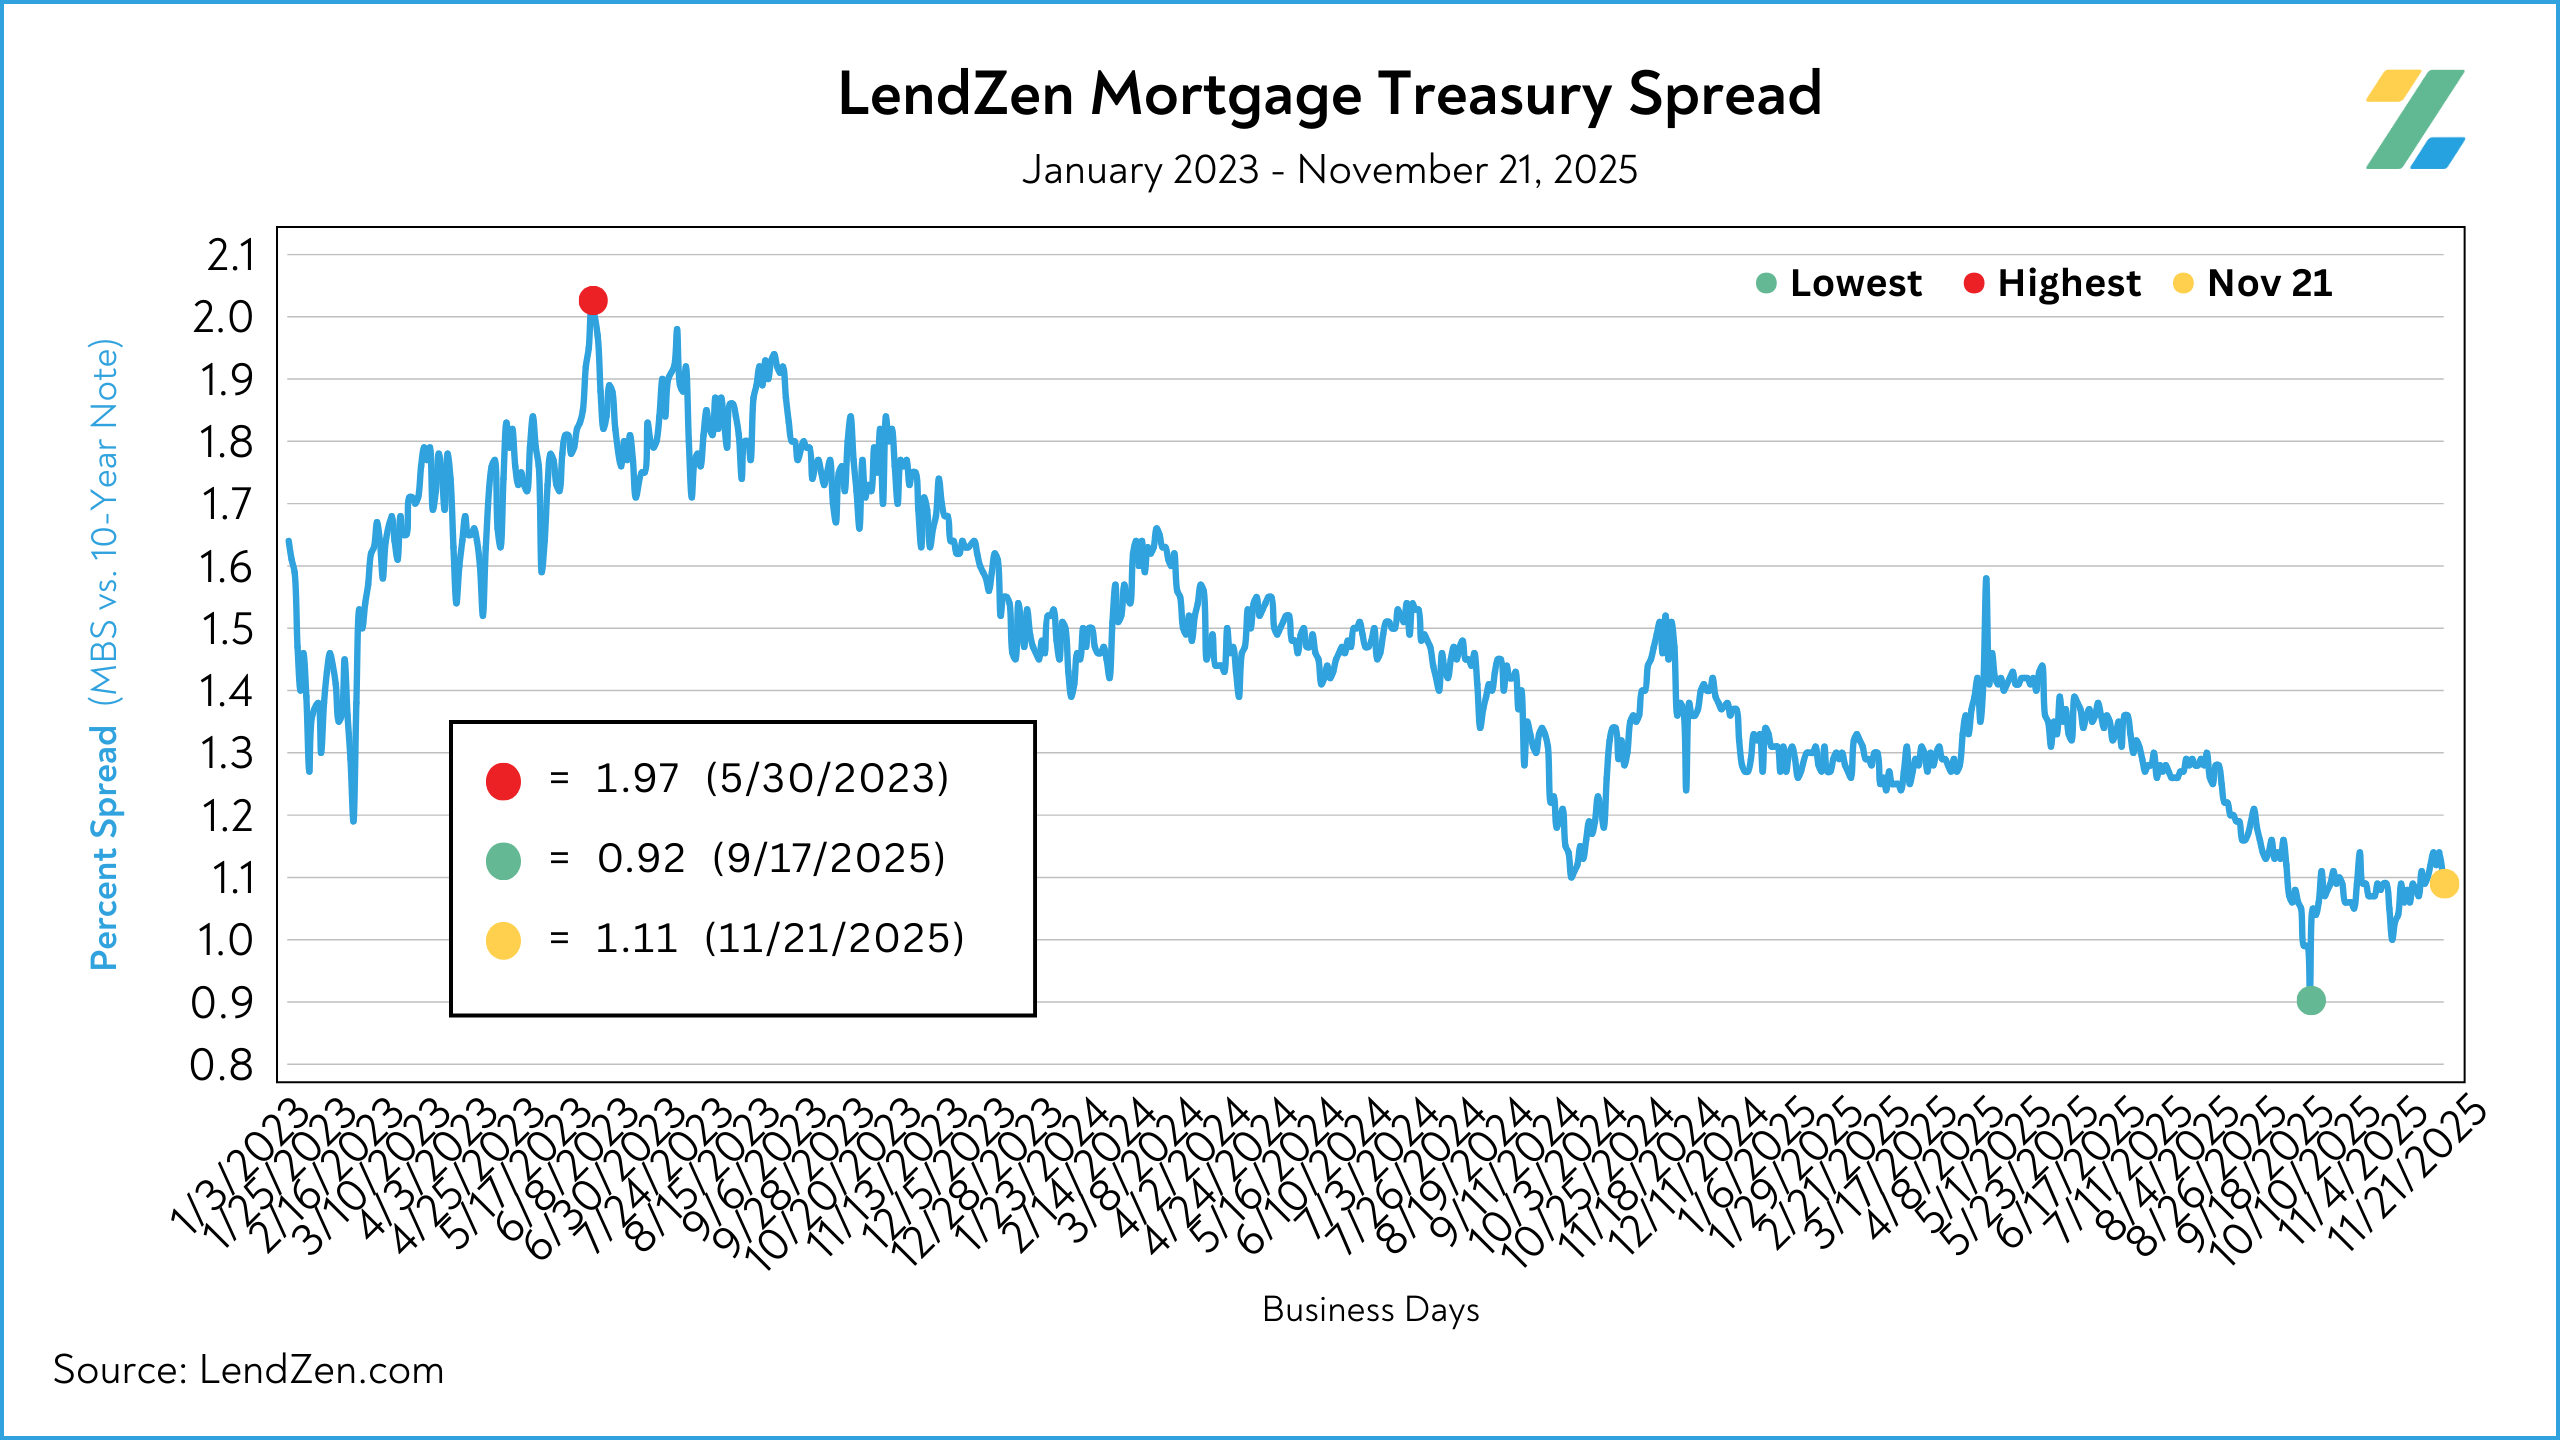
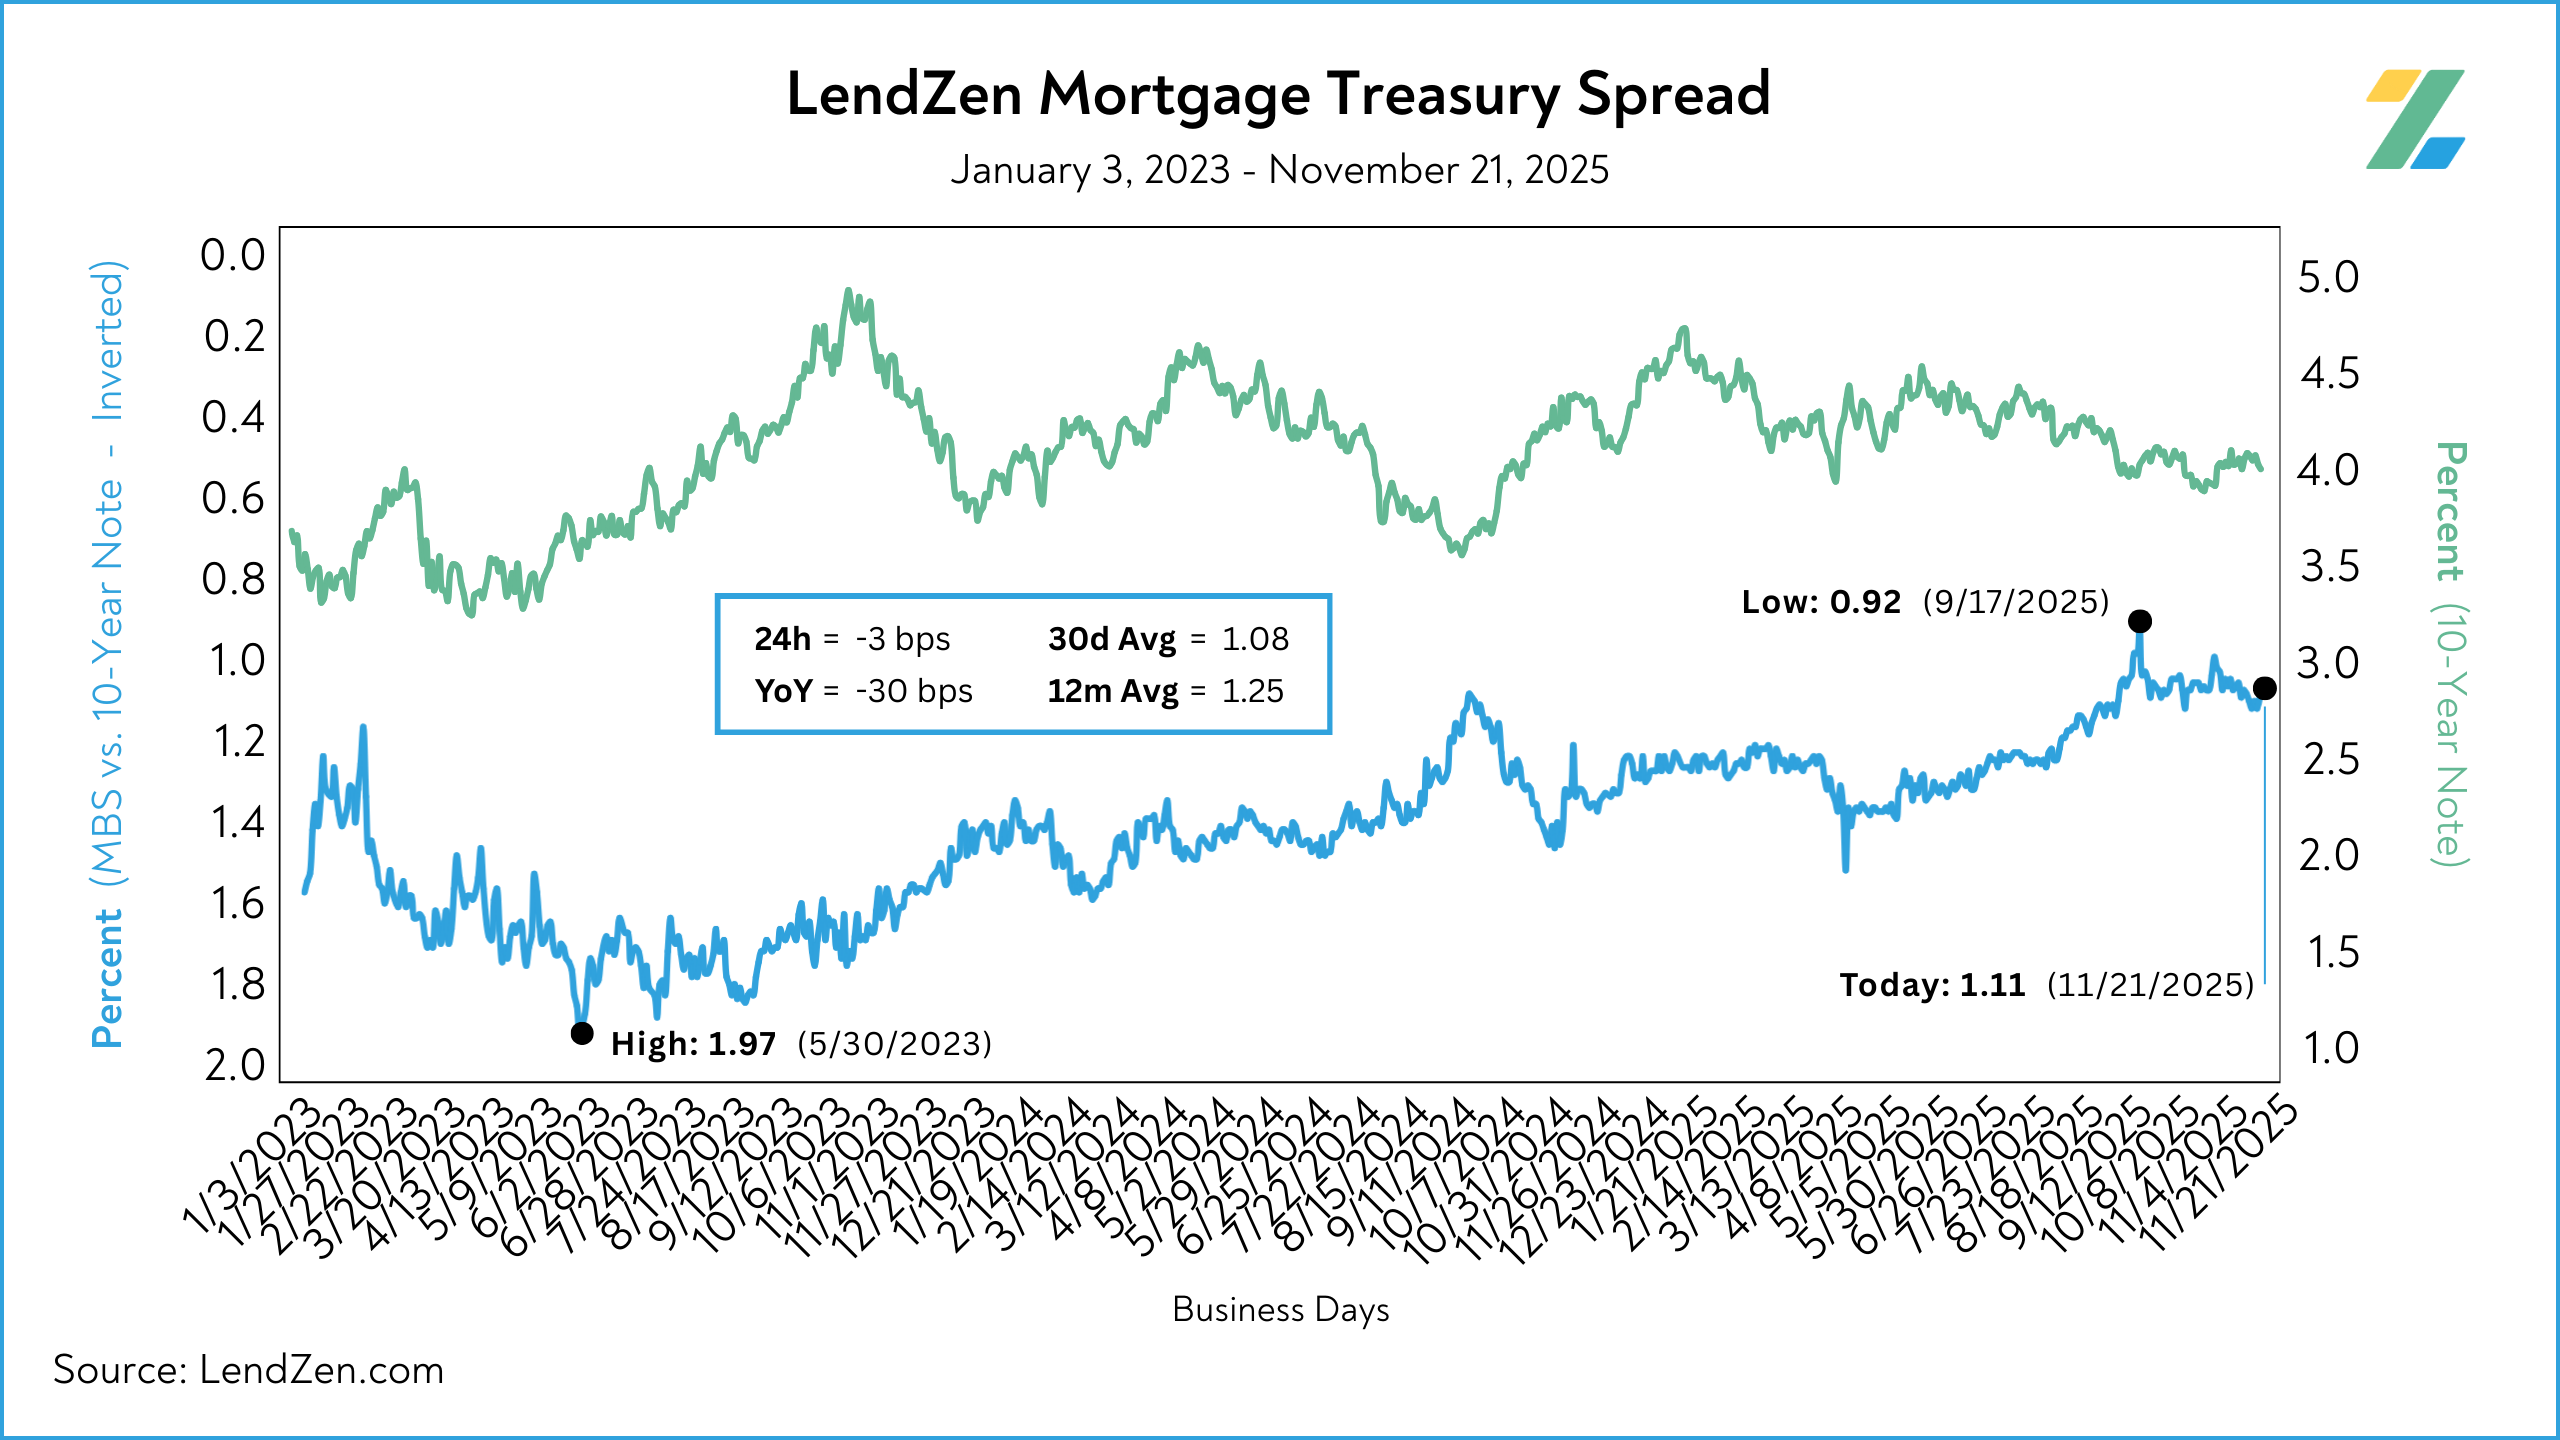
Published daily with the LendZen Index is the LendZen Mortgage-Treasury Spread.
The LMTS uses actual bond yields to create a historically consistent, and reliable, data set.
Learn more about the importance of accurately calculating spreads on this Substack post.
The spread between mortgage bonds and the U.S. 10-Year tightened 1-bps during the week.
Nov 17 = 1.12
Nov 21 = 1.11
30d Avg = 1.08
12m Avg = 1.25
YoY = - 30 bps (1.41)
With a decline of over 30 bps since last year, spreads have been the real story behind mortgage rates now versus 2024.
Get the full scoop in this recent Substack post.
HOUSING DATA 🏠
---------------------
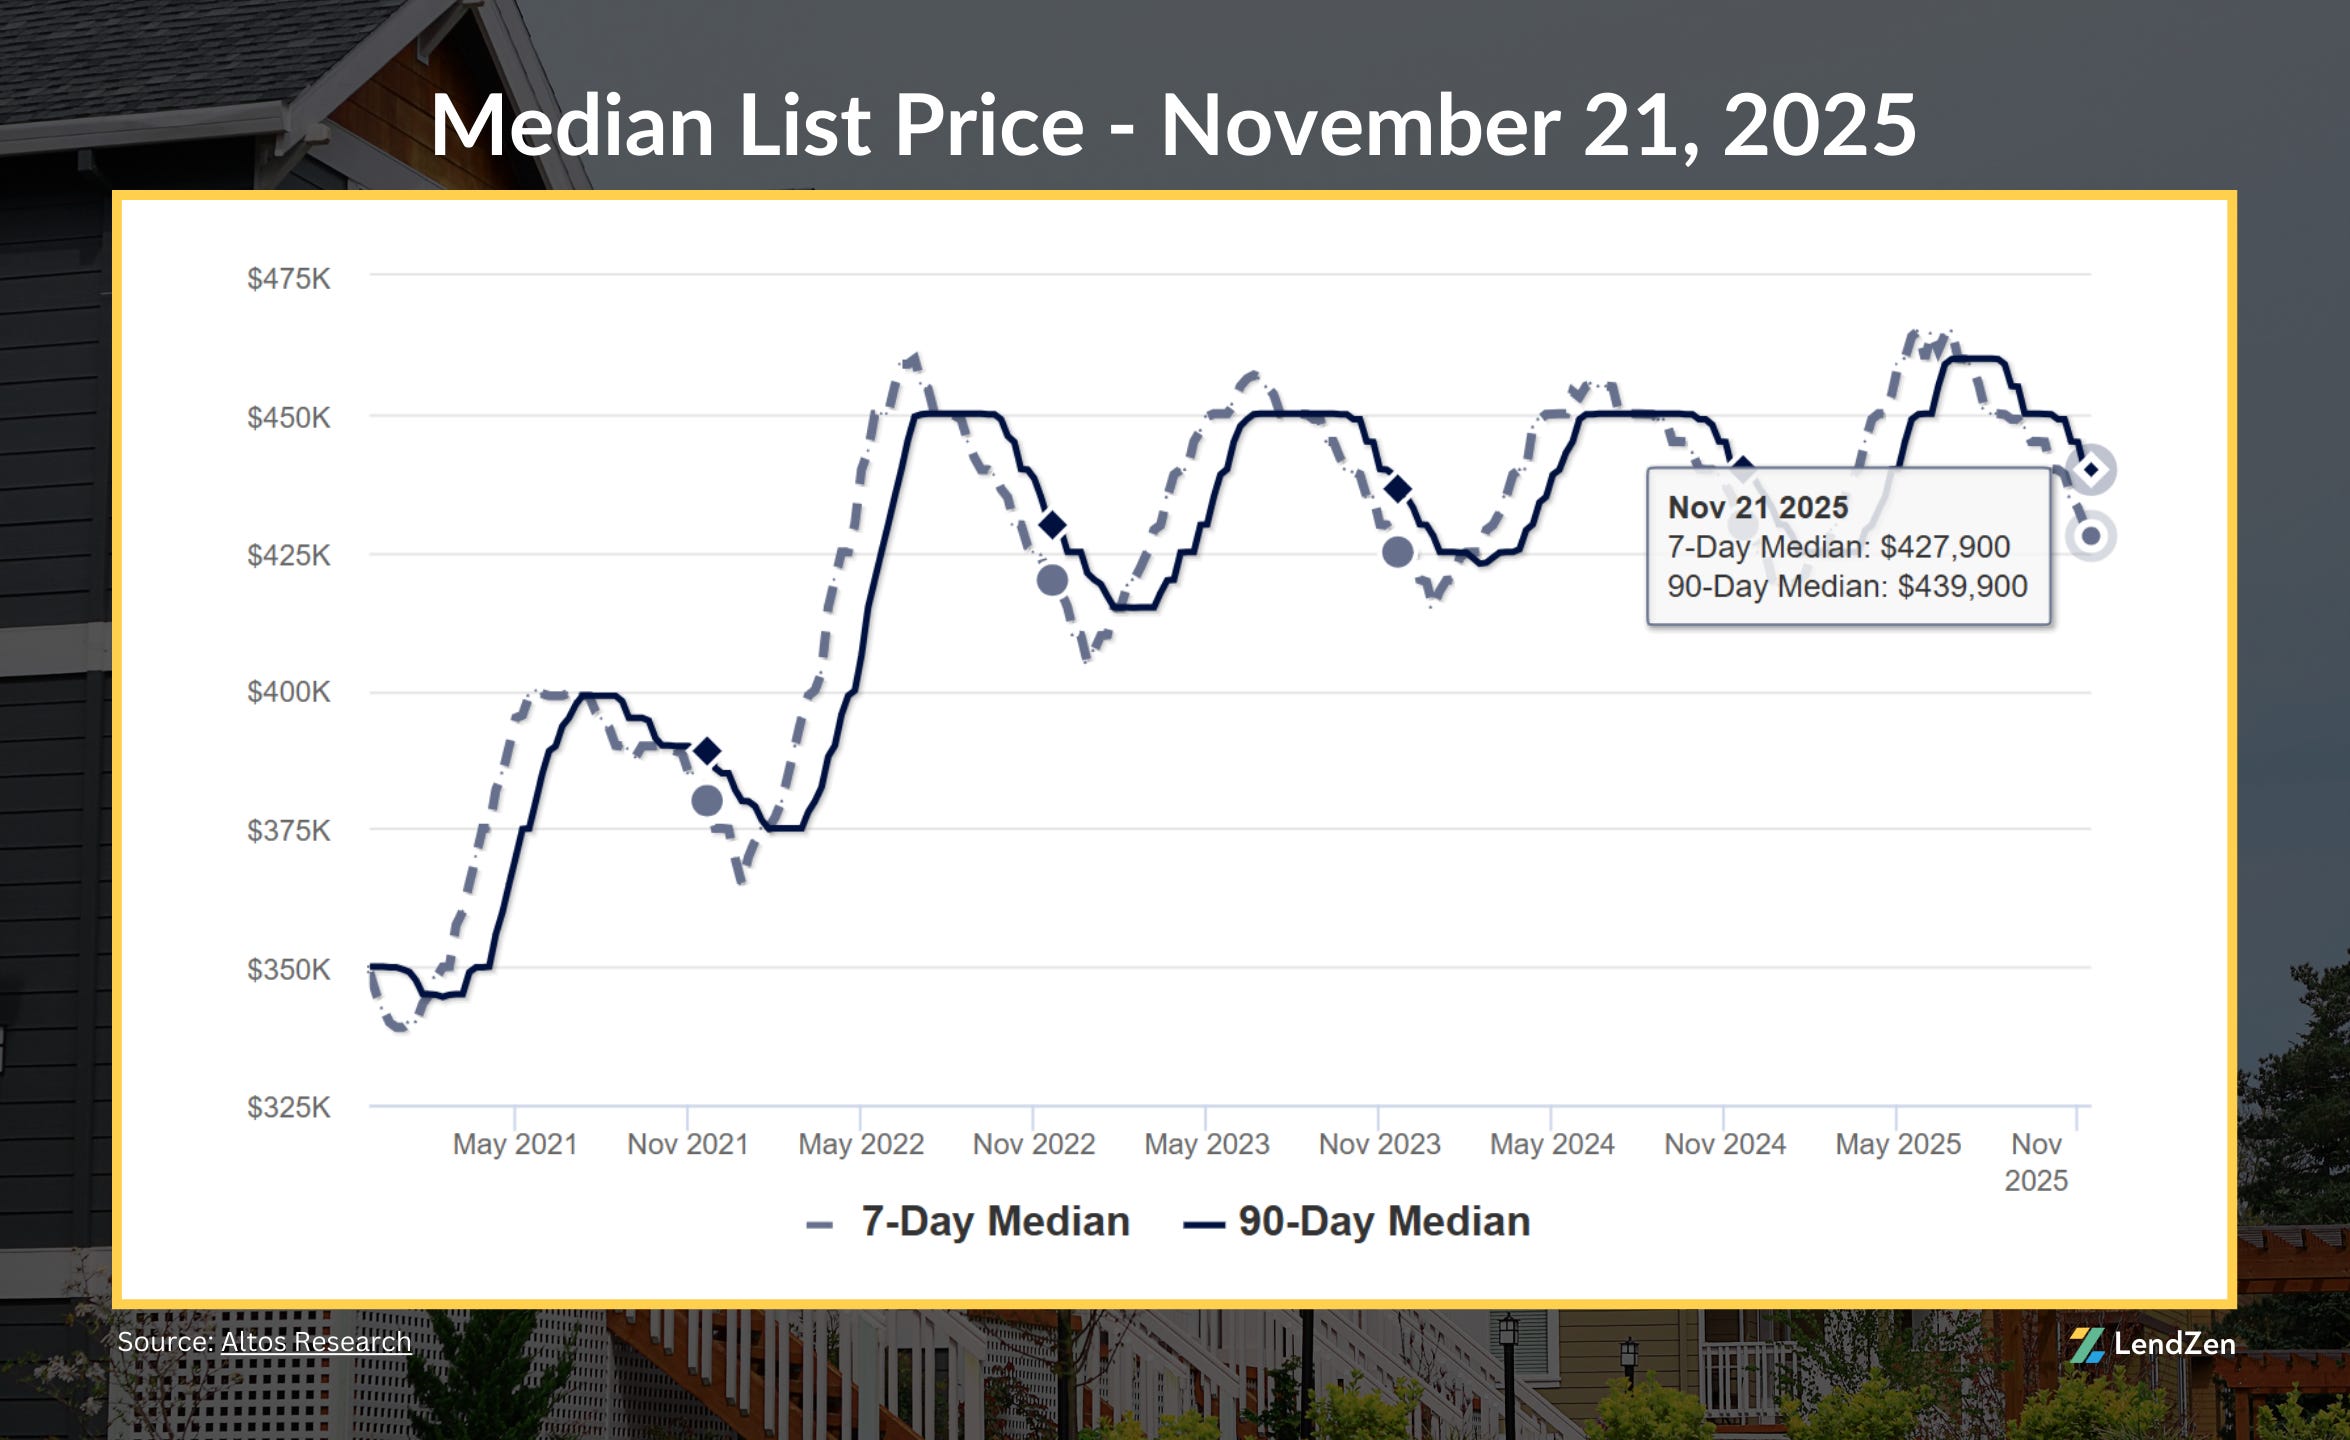
Here are the latest housing market stats, with trends from the last 90 days.
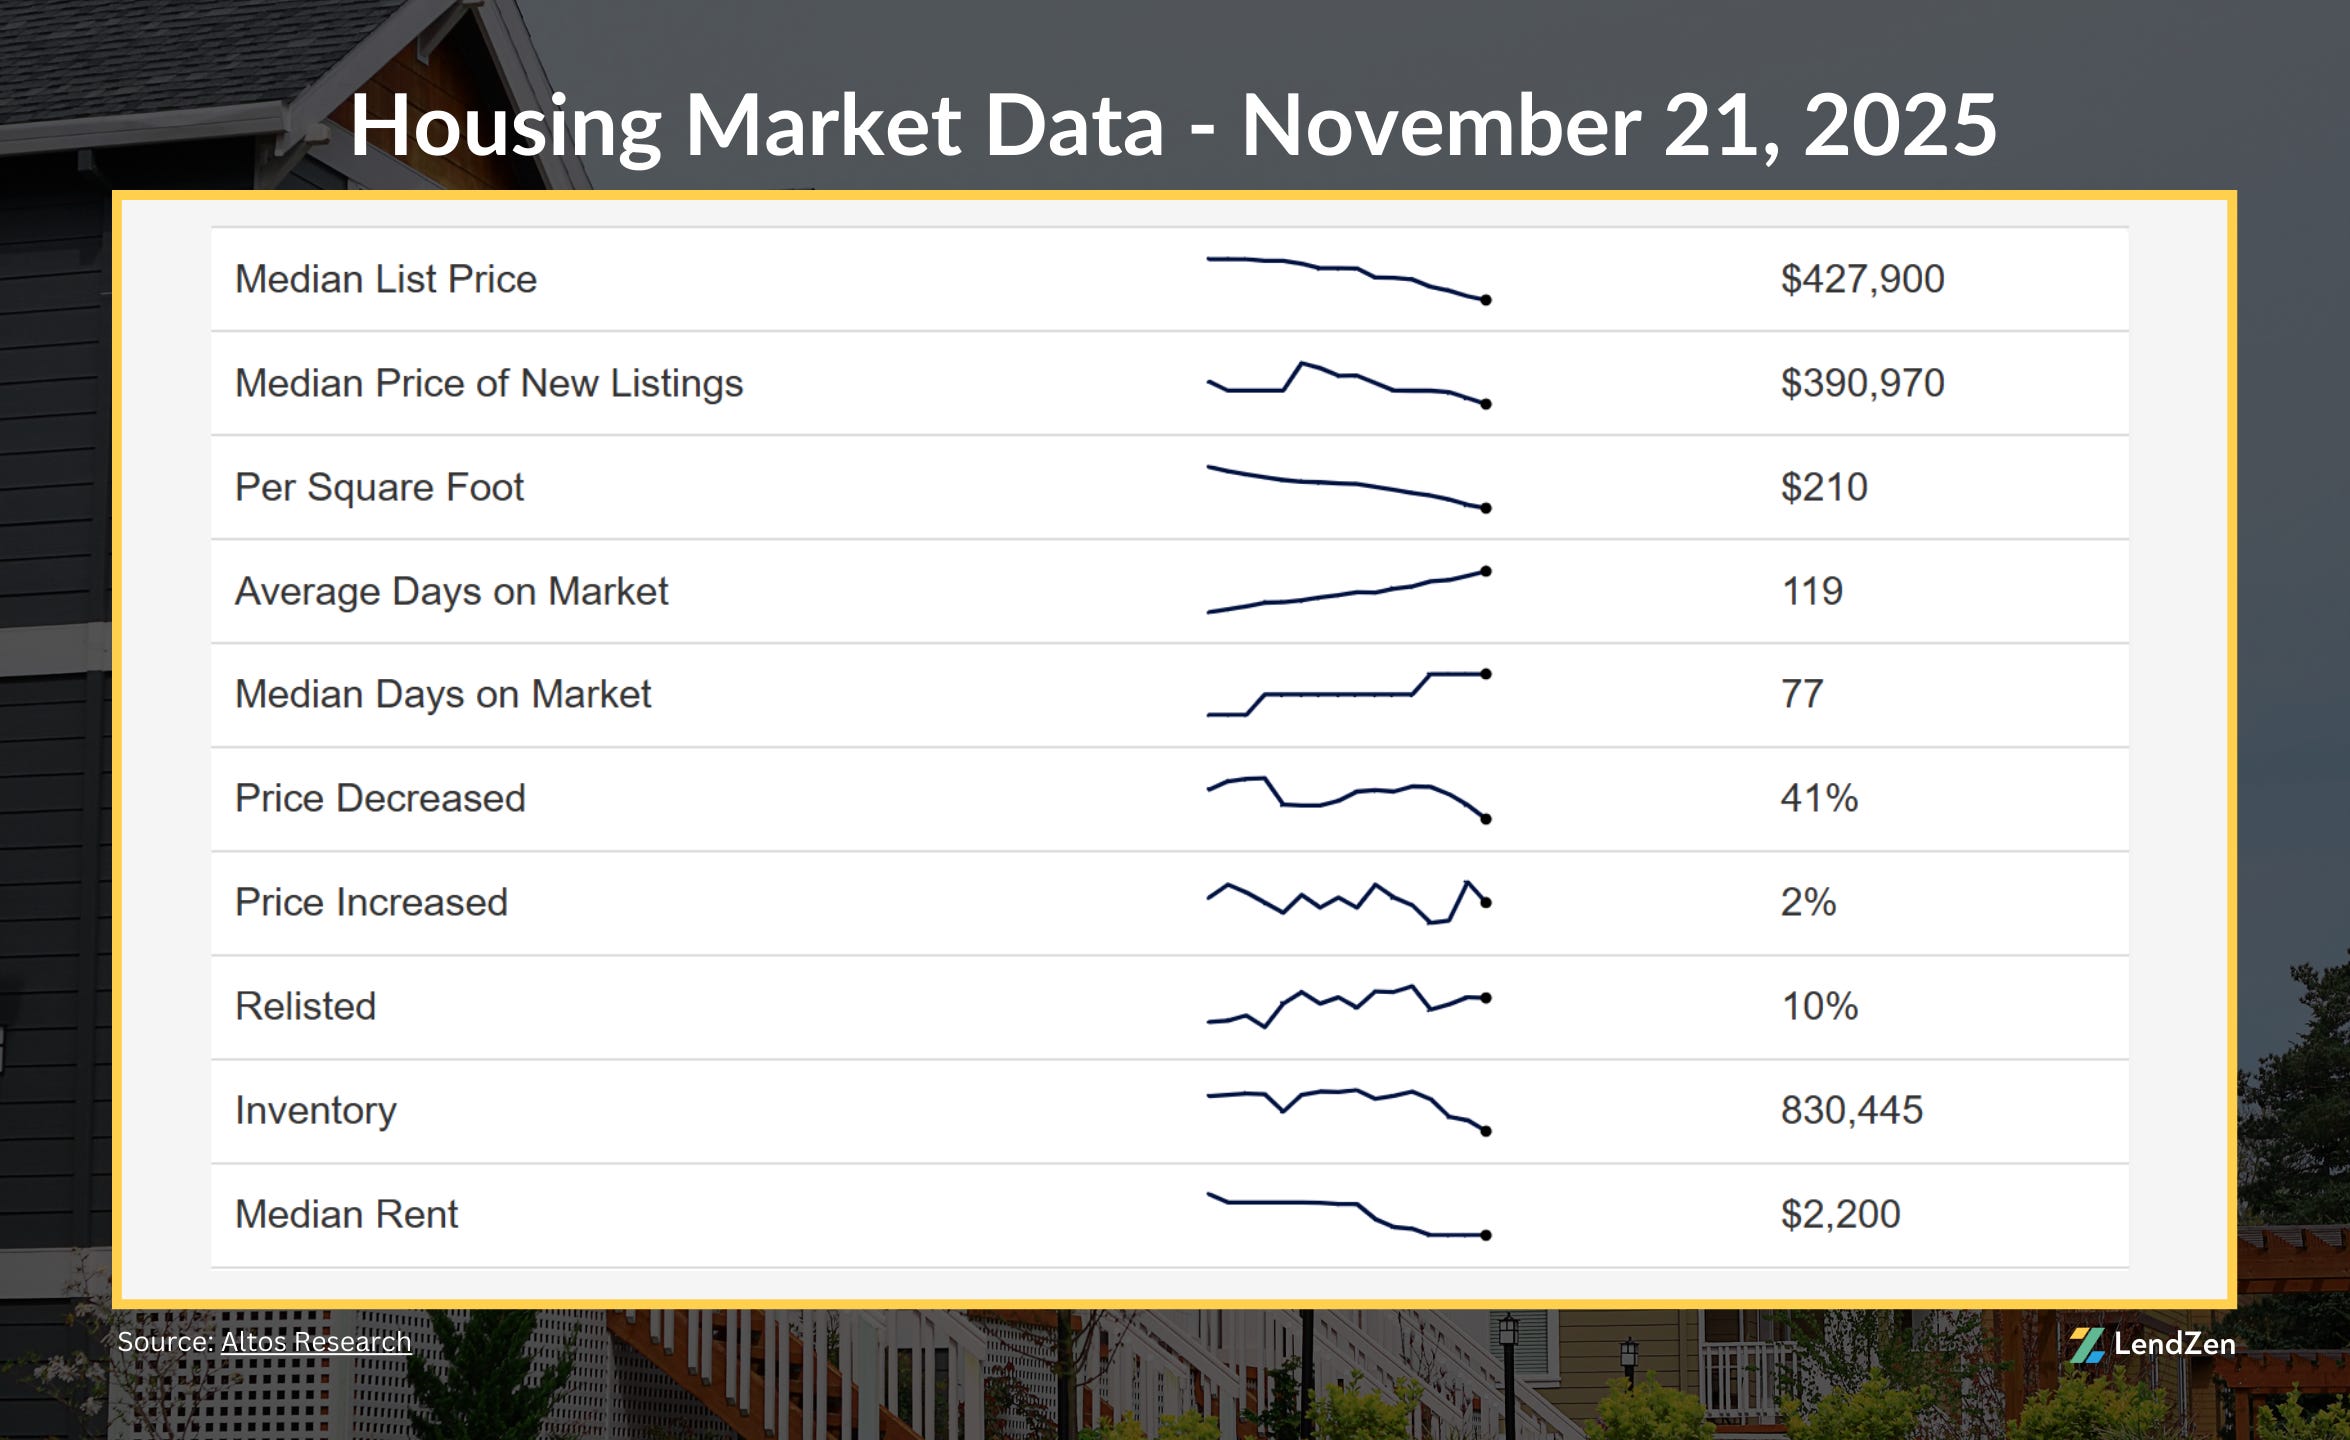
The U.S. median list price is $427,900, down about 0.5% since last week.
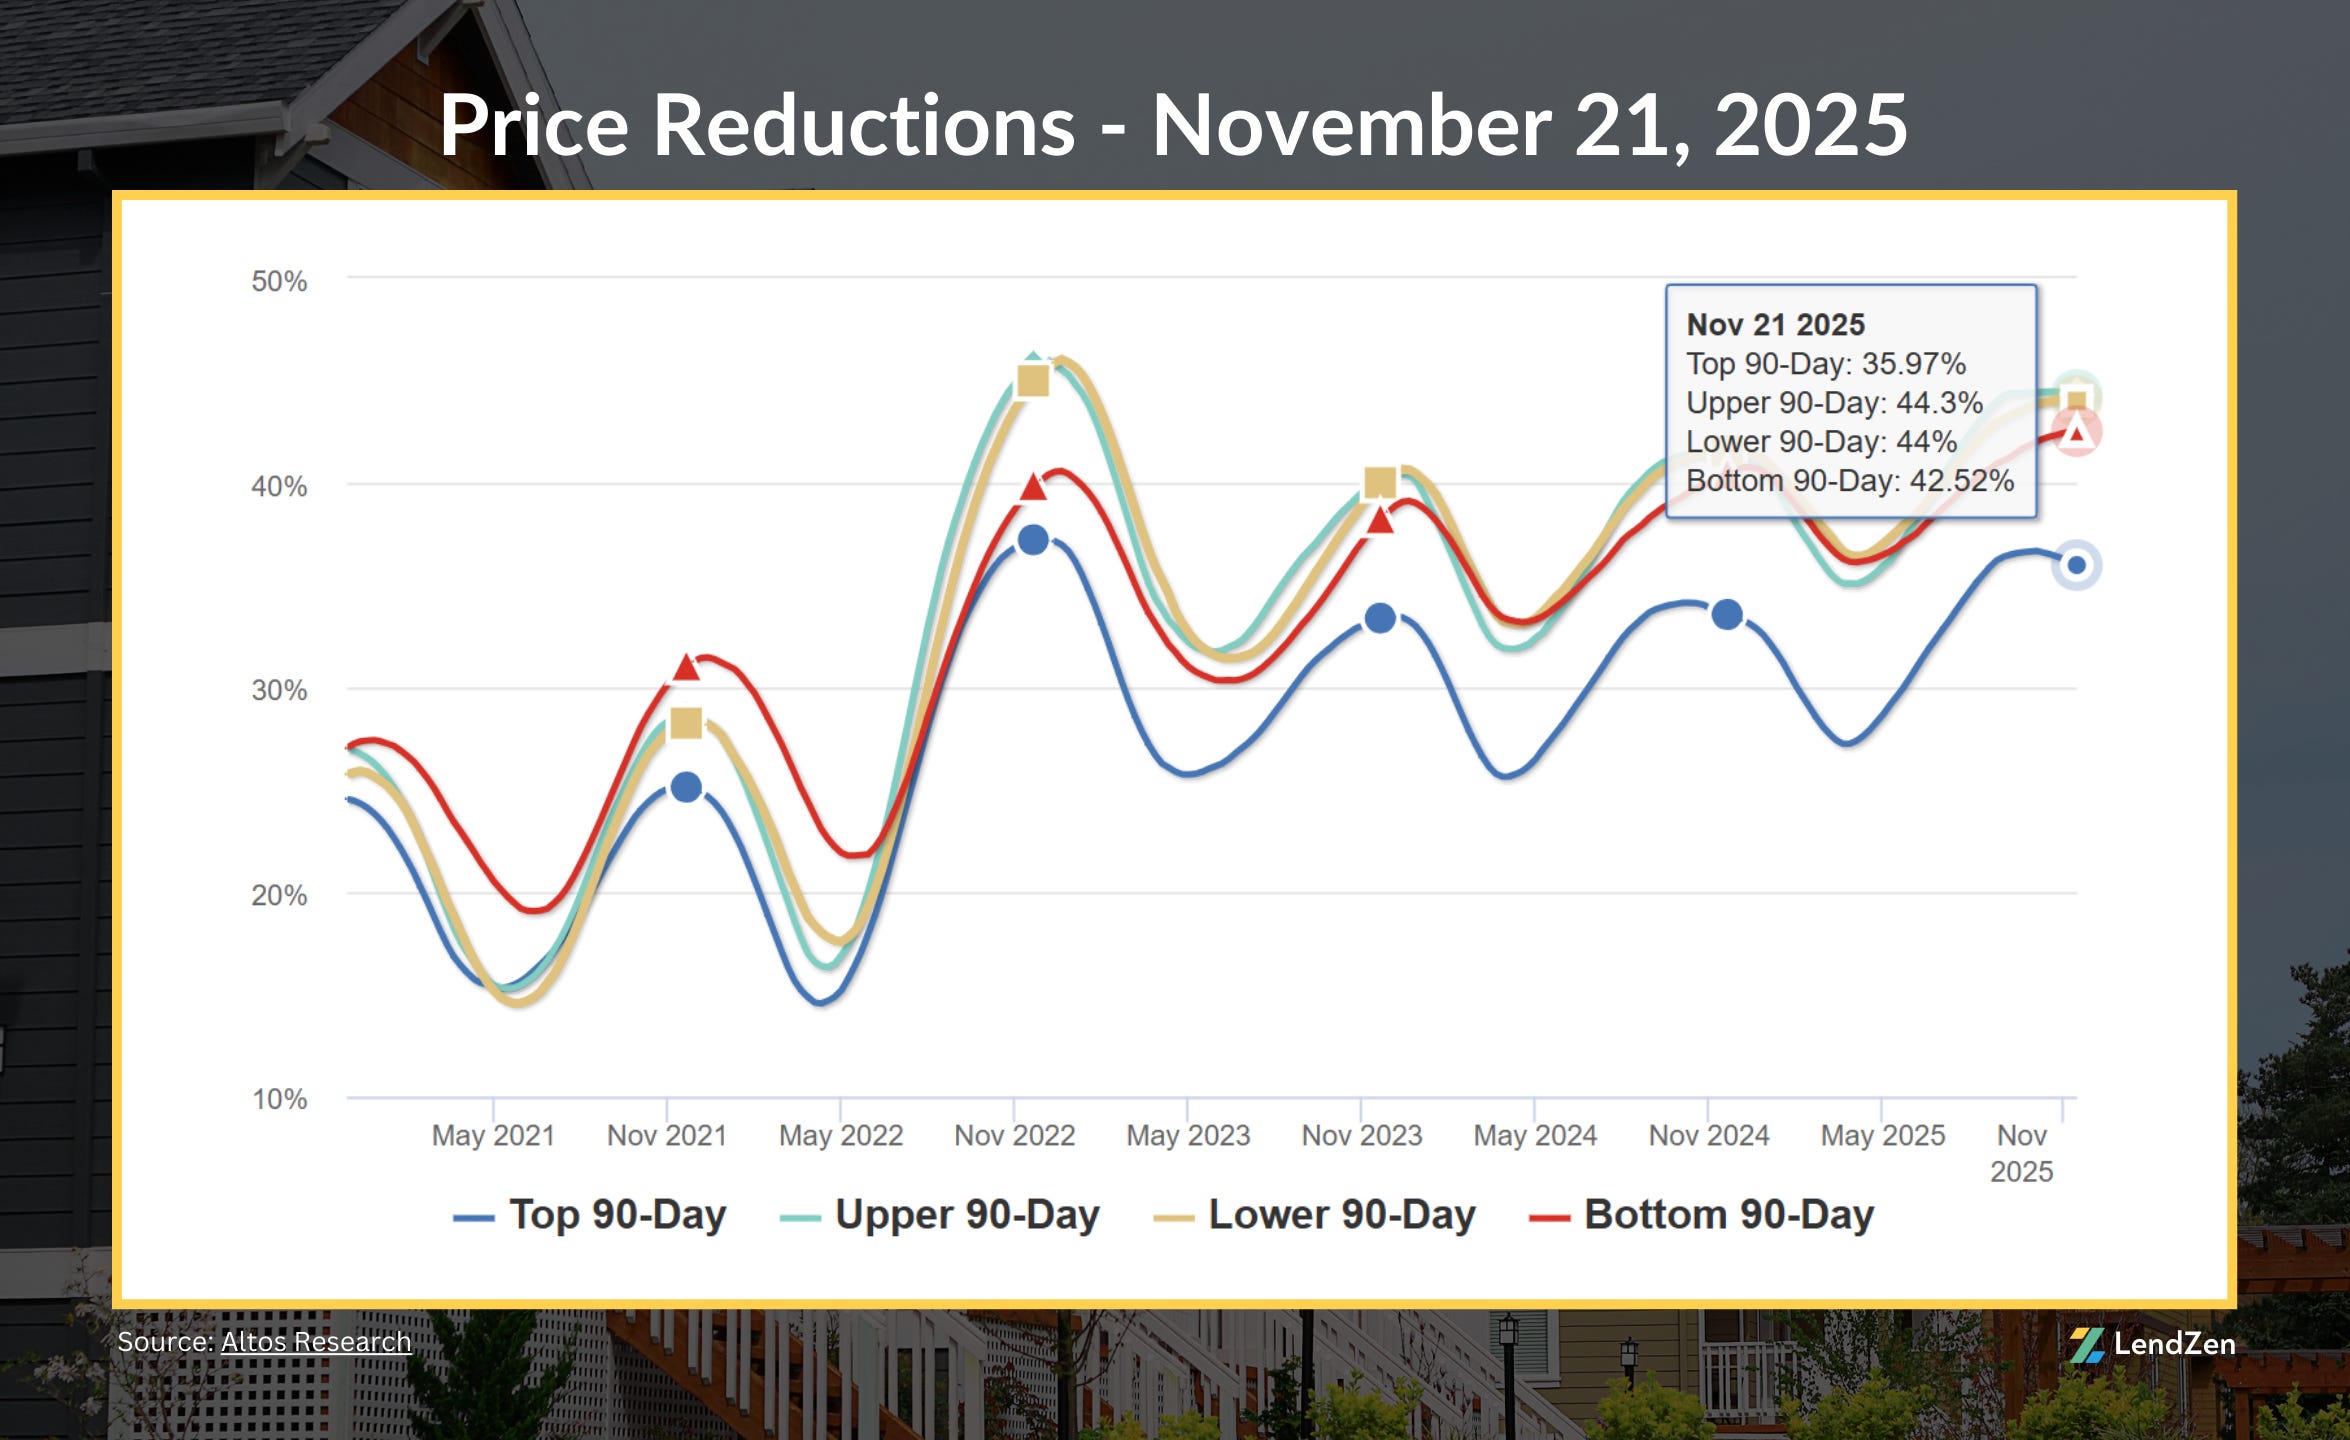
Price reductions remain steady with a 90-day national average of 41%.
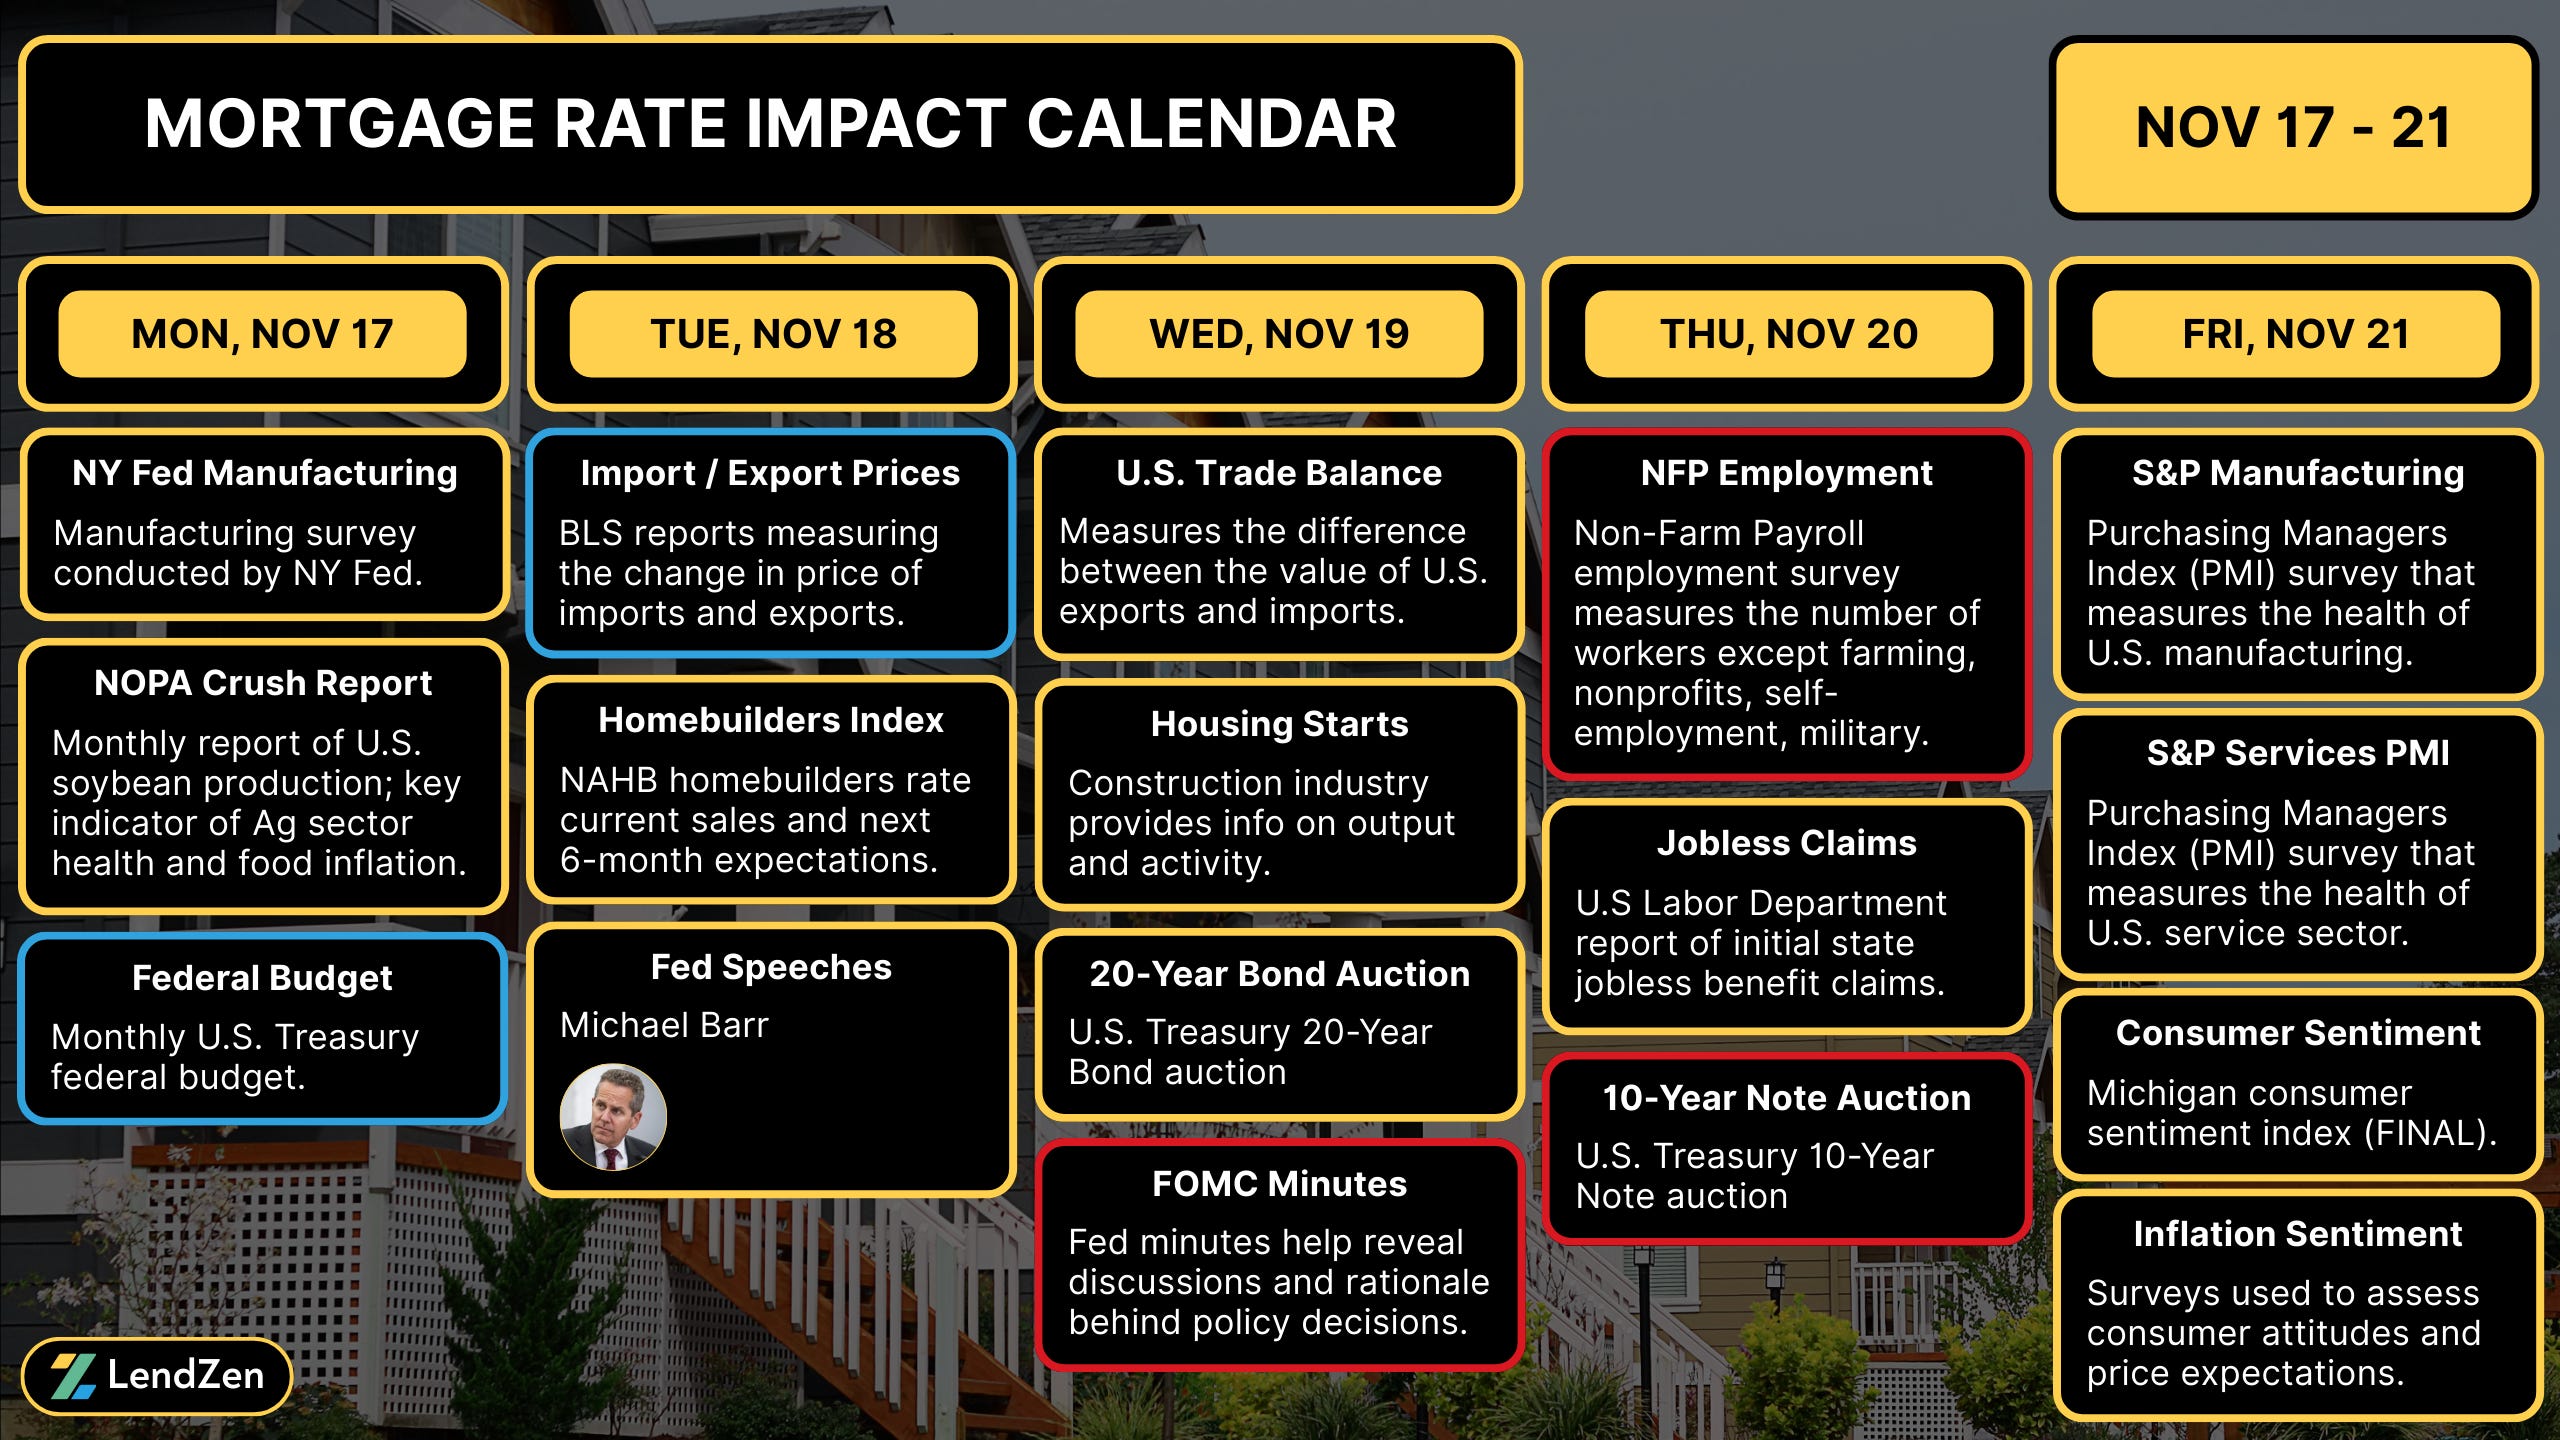
WEEK AHEAD 📅
------------------
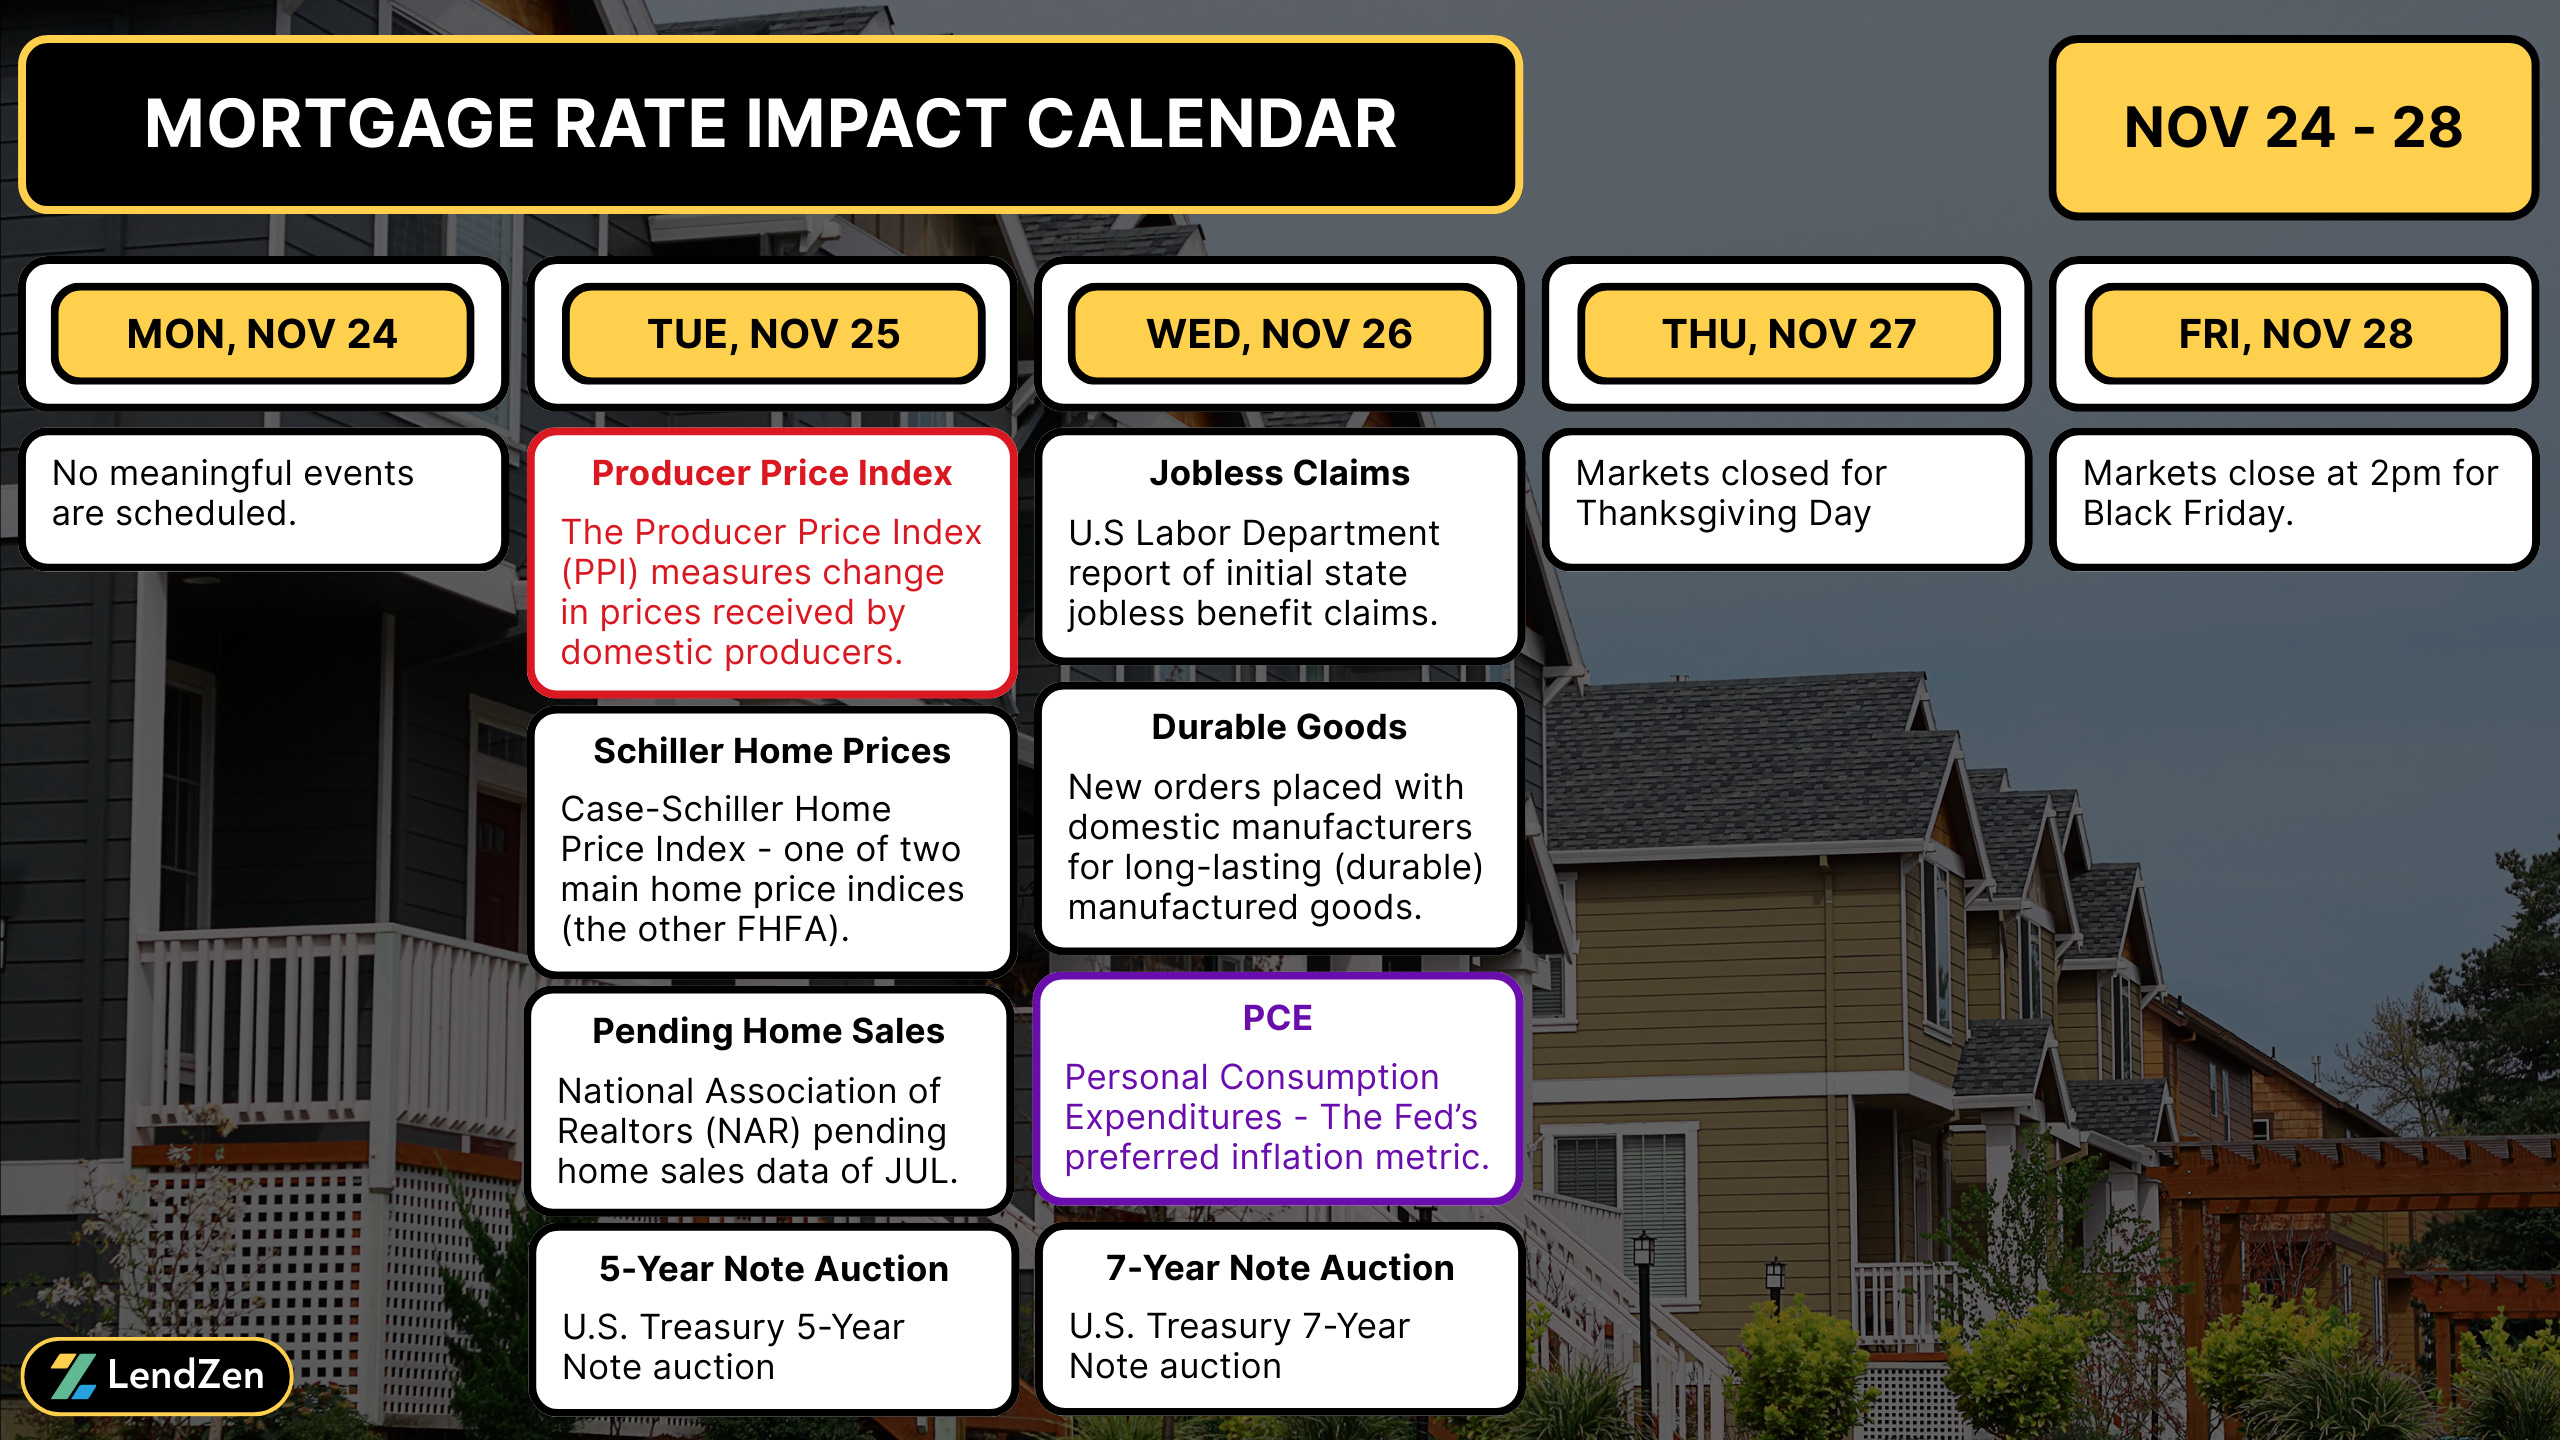
This week markets are closed Thursday for the Thanksgiving holiday, but on Wednesday PPI and Retails Sales data could give investors something to chew on (besides a turkey leg) in the absence of rescheduled PCE inflation.
Read more in yesterday’s Week Ahead.
**Events marked purple have been rescheduled as a result of the shutdown.
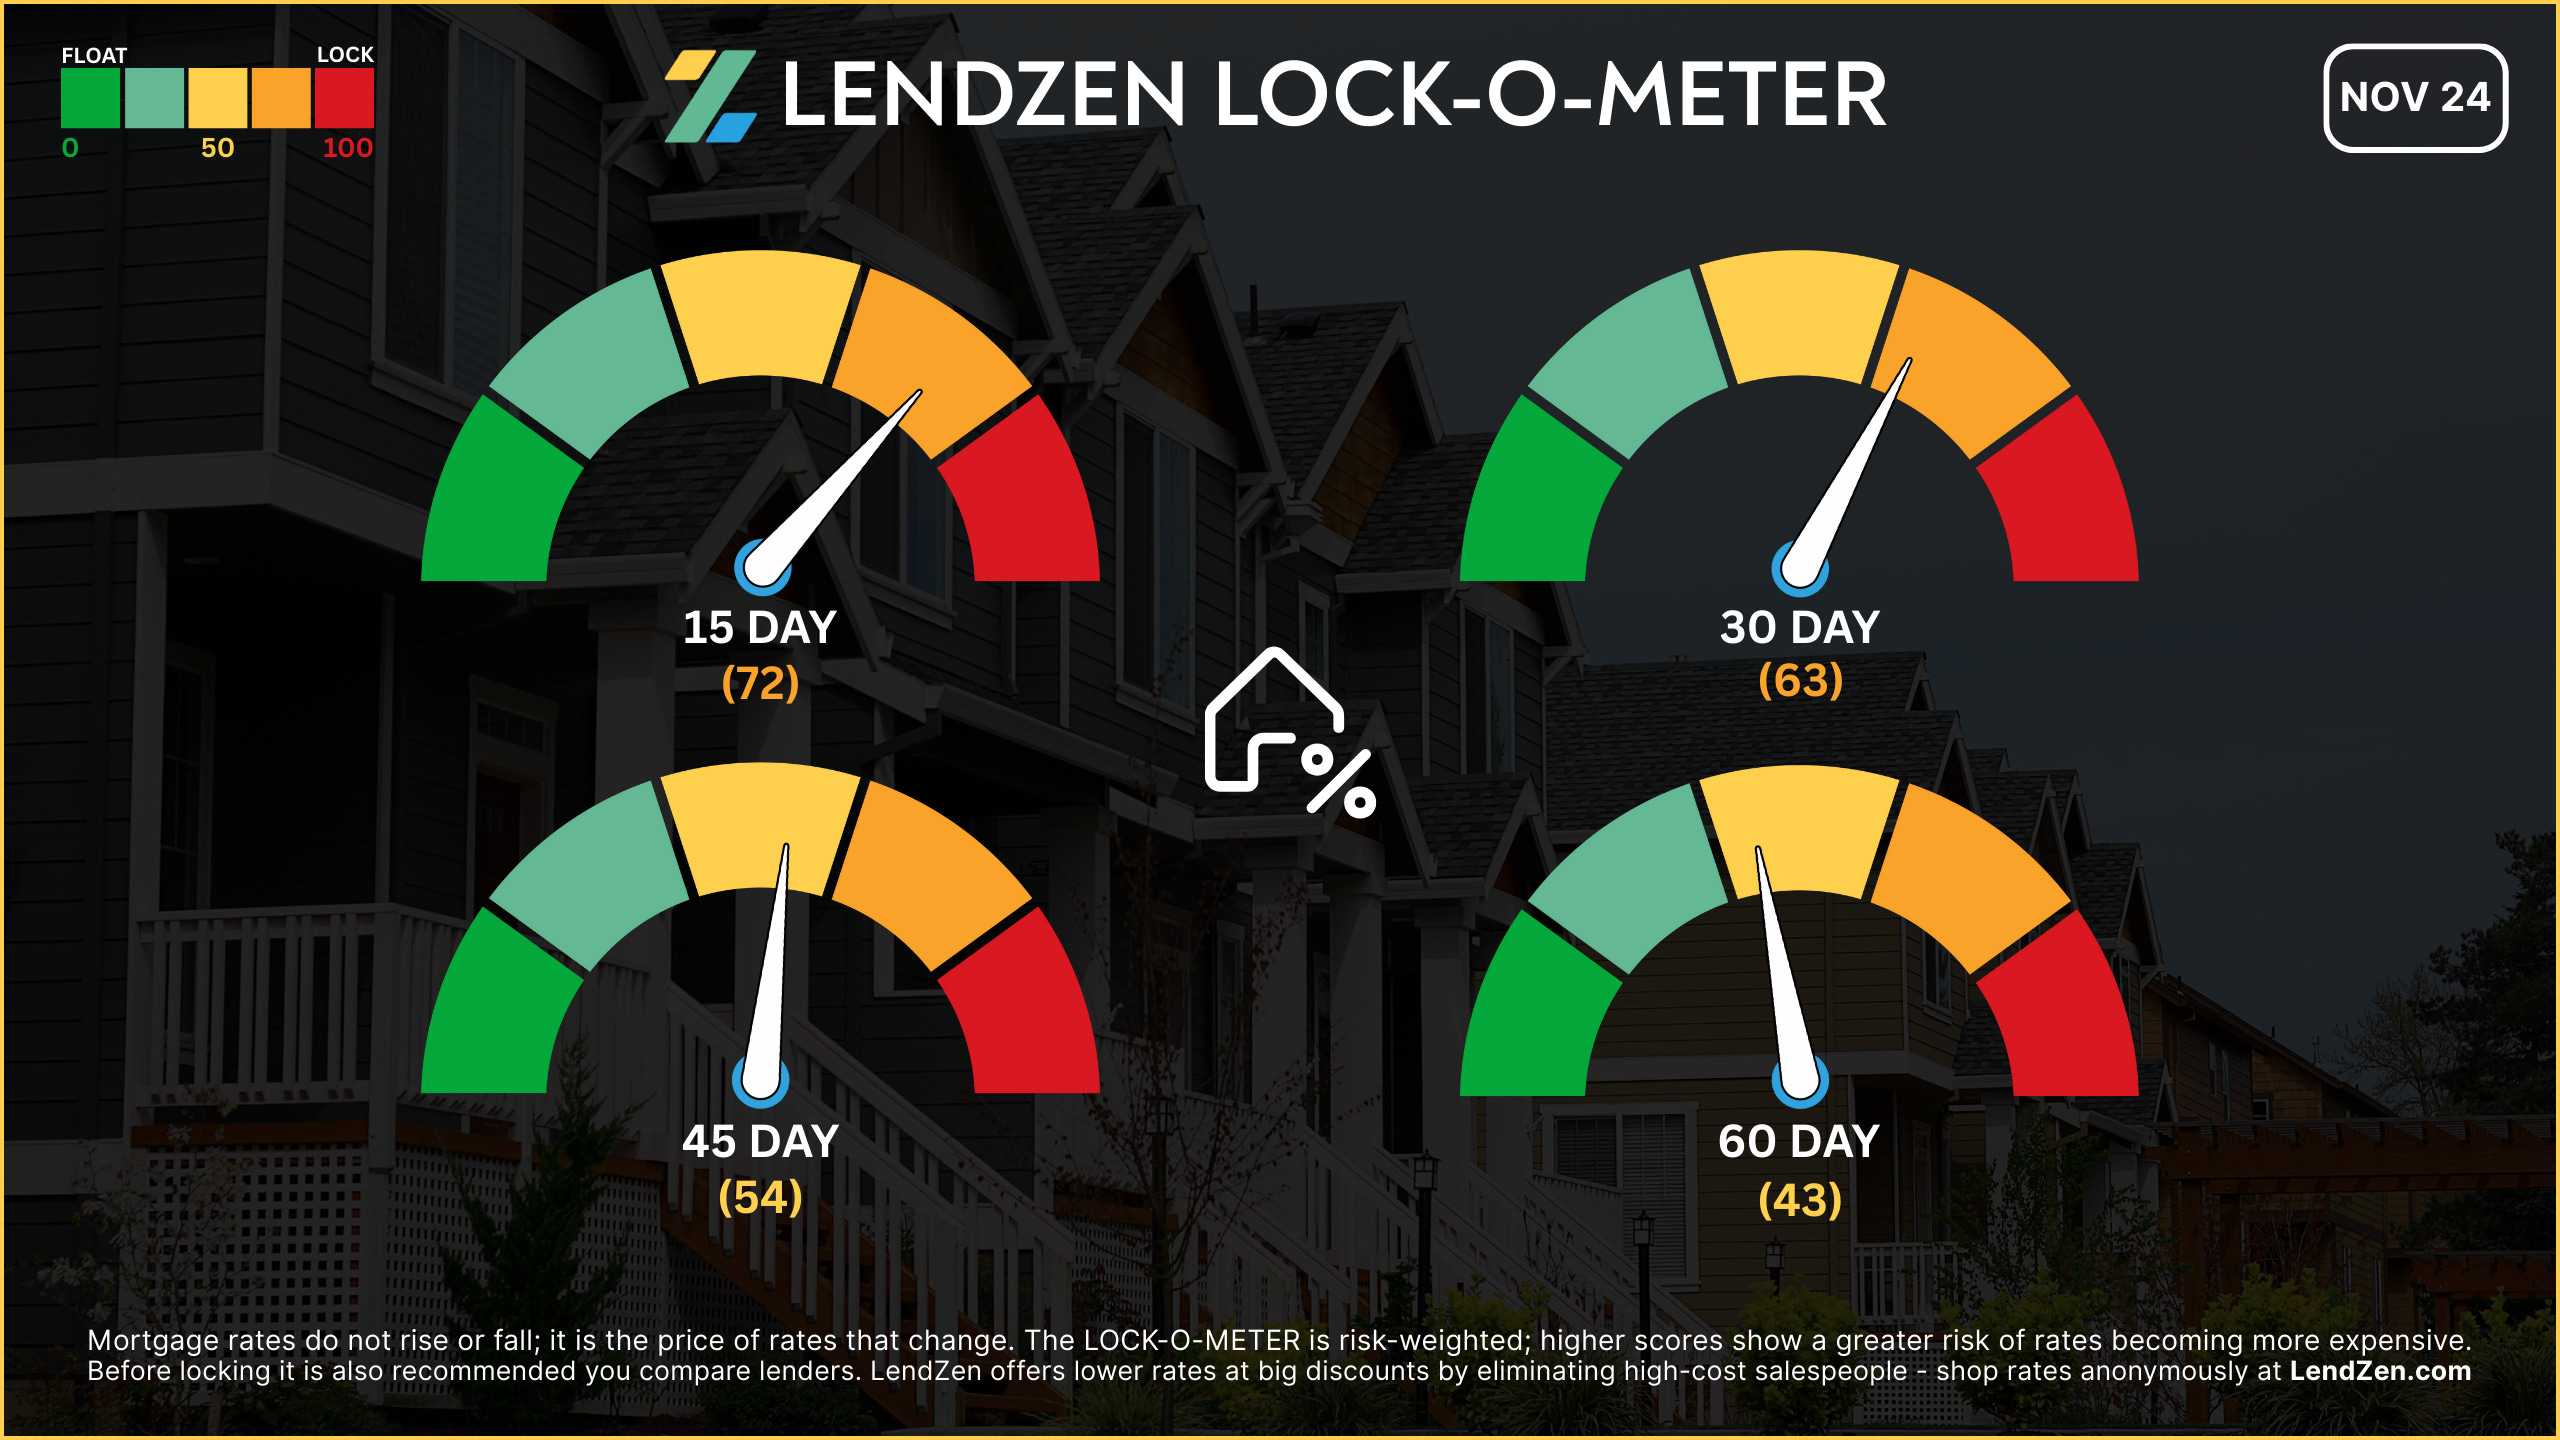
RATE LOCK GUIDE 🔒
---------------------
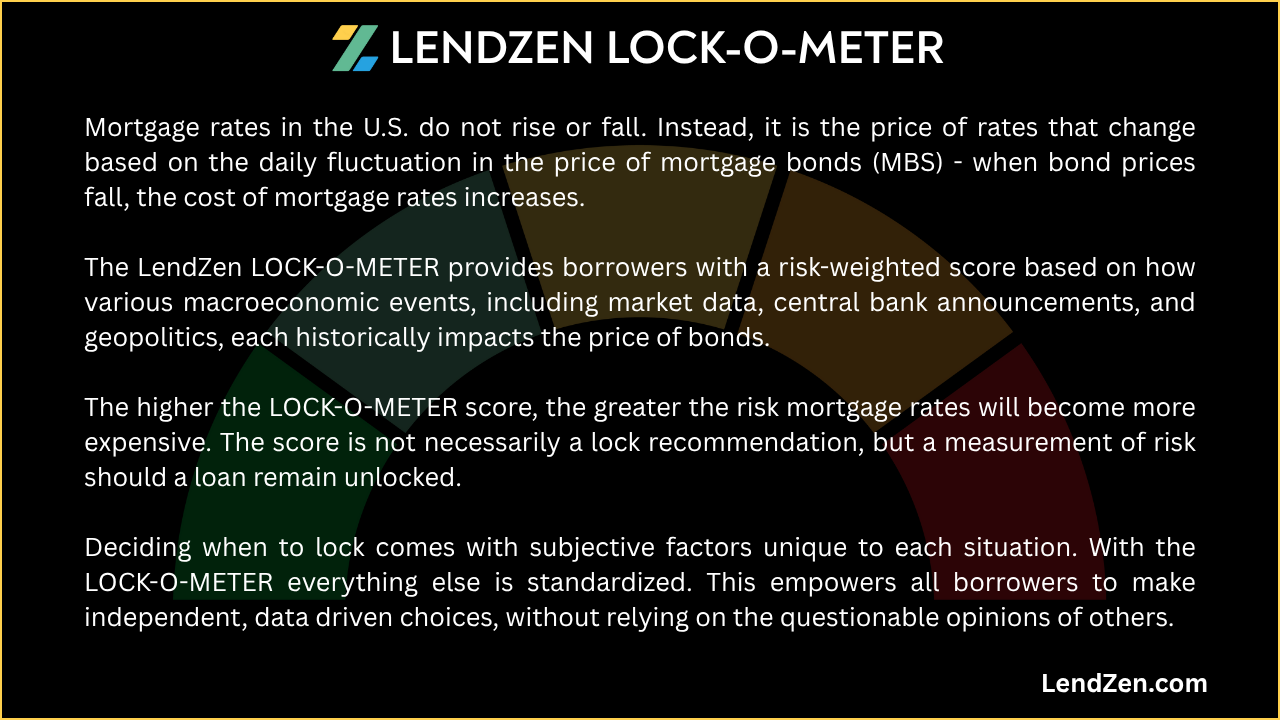
The LendZen LOCK-O-METER provides borrowers with a risk-weighted score based on how various macroeconomic events, including market data, central bank announcements, and geopolitics, each historically impacts the price of bonds.
higher risk scores = lean towards locking
------------------
Closing Window
------------------
[ 15 Days ] -- 72 🟠
Risk skewed to locking, especially with random moves from low-volume holiday trading and few clear bullish catalysts left before the Dec 9-10 Fed meeting.
[ 30 Days ] -- 63 🟠
Still very event-dependent with the big movers coming towards the end of this window with the FOMC rate decision and November NFP.
[ 45 Days ] -- 54 🟡
We are far enough into November that the 45-day closing windows stretches into 2026. If bonds survive the first half of December it could be worth locking and enjoying the holiday season without mortgage rate stress.
[ 60 Days ] -- 43 🟡
The longer-term float case remains alive. Bond market positioning has calmed since the late October sell-off, but more confirmation is required from backlogged economic data and Fed policy.
If you are already in a strong position locking generally makes the most sense, especially for shorter windows, since the focus should be on making a savvy rate choice based on your longer-term rate outlook.
I expand on this “long game” approach in this Substack post.
Thanks for reading.
If you want to shop real-time mortgage rates and get instant qualification results without providing any contact information visit LendZen.com
LendZen provides a fully automated mortgage shopping experience that gives you anonymous access to all mortgage rates with full transparency of costs upfront as bond prices change.
LendZen Inc. is an equal opportunity mortgage lender, NMLS 375788.