
Mortgage Rate Data Deluge – NOV 10 🏠📉🔒
Here is a deluge of mortgage rate data to start your week!

WATCH LIST 👀
---------------
Fork in the road:
Bonds have stabilized following the Fed rate cut sell-off, but remain unconvinced whether the months-long rally can continue or if the recent sell-off has only just begun.
Escaping the void:
The current government shutdown is now the longest ever in history, leaving a void of economic data since the standoff began October 1. Since then investors have been forced to fight over scraps of information from less reliable sources, leaving more questions than answers. With a resolution on the table, markets will finally catch up on a backlog of data.
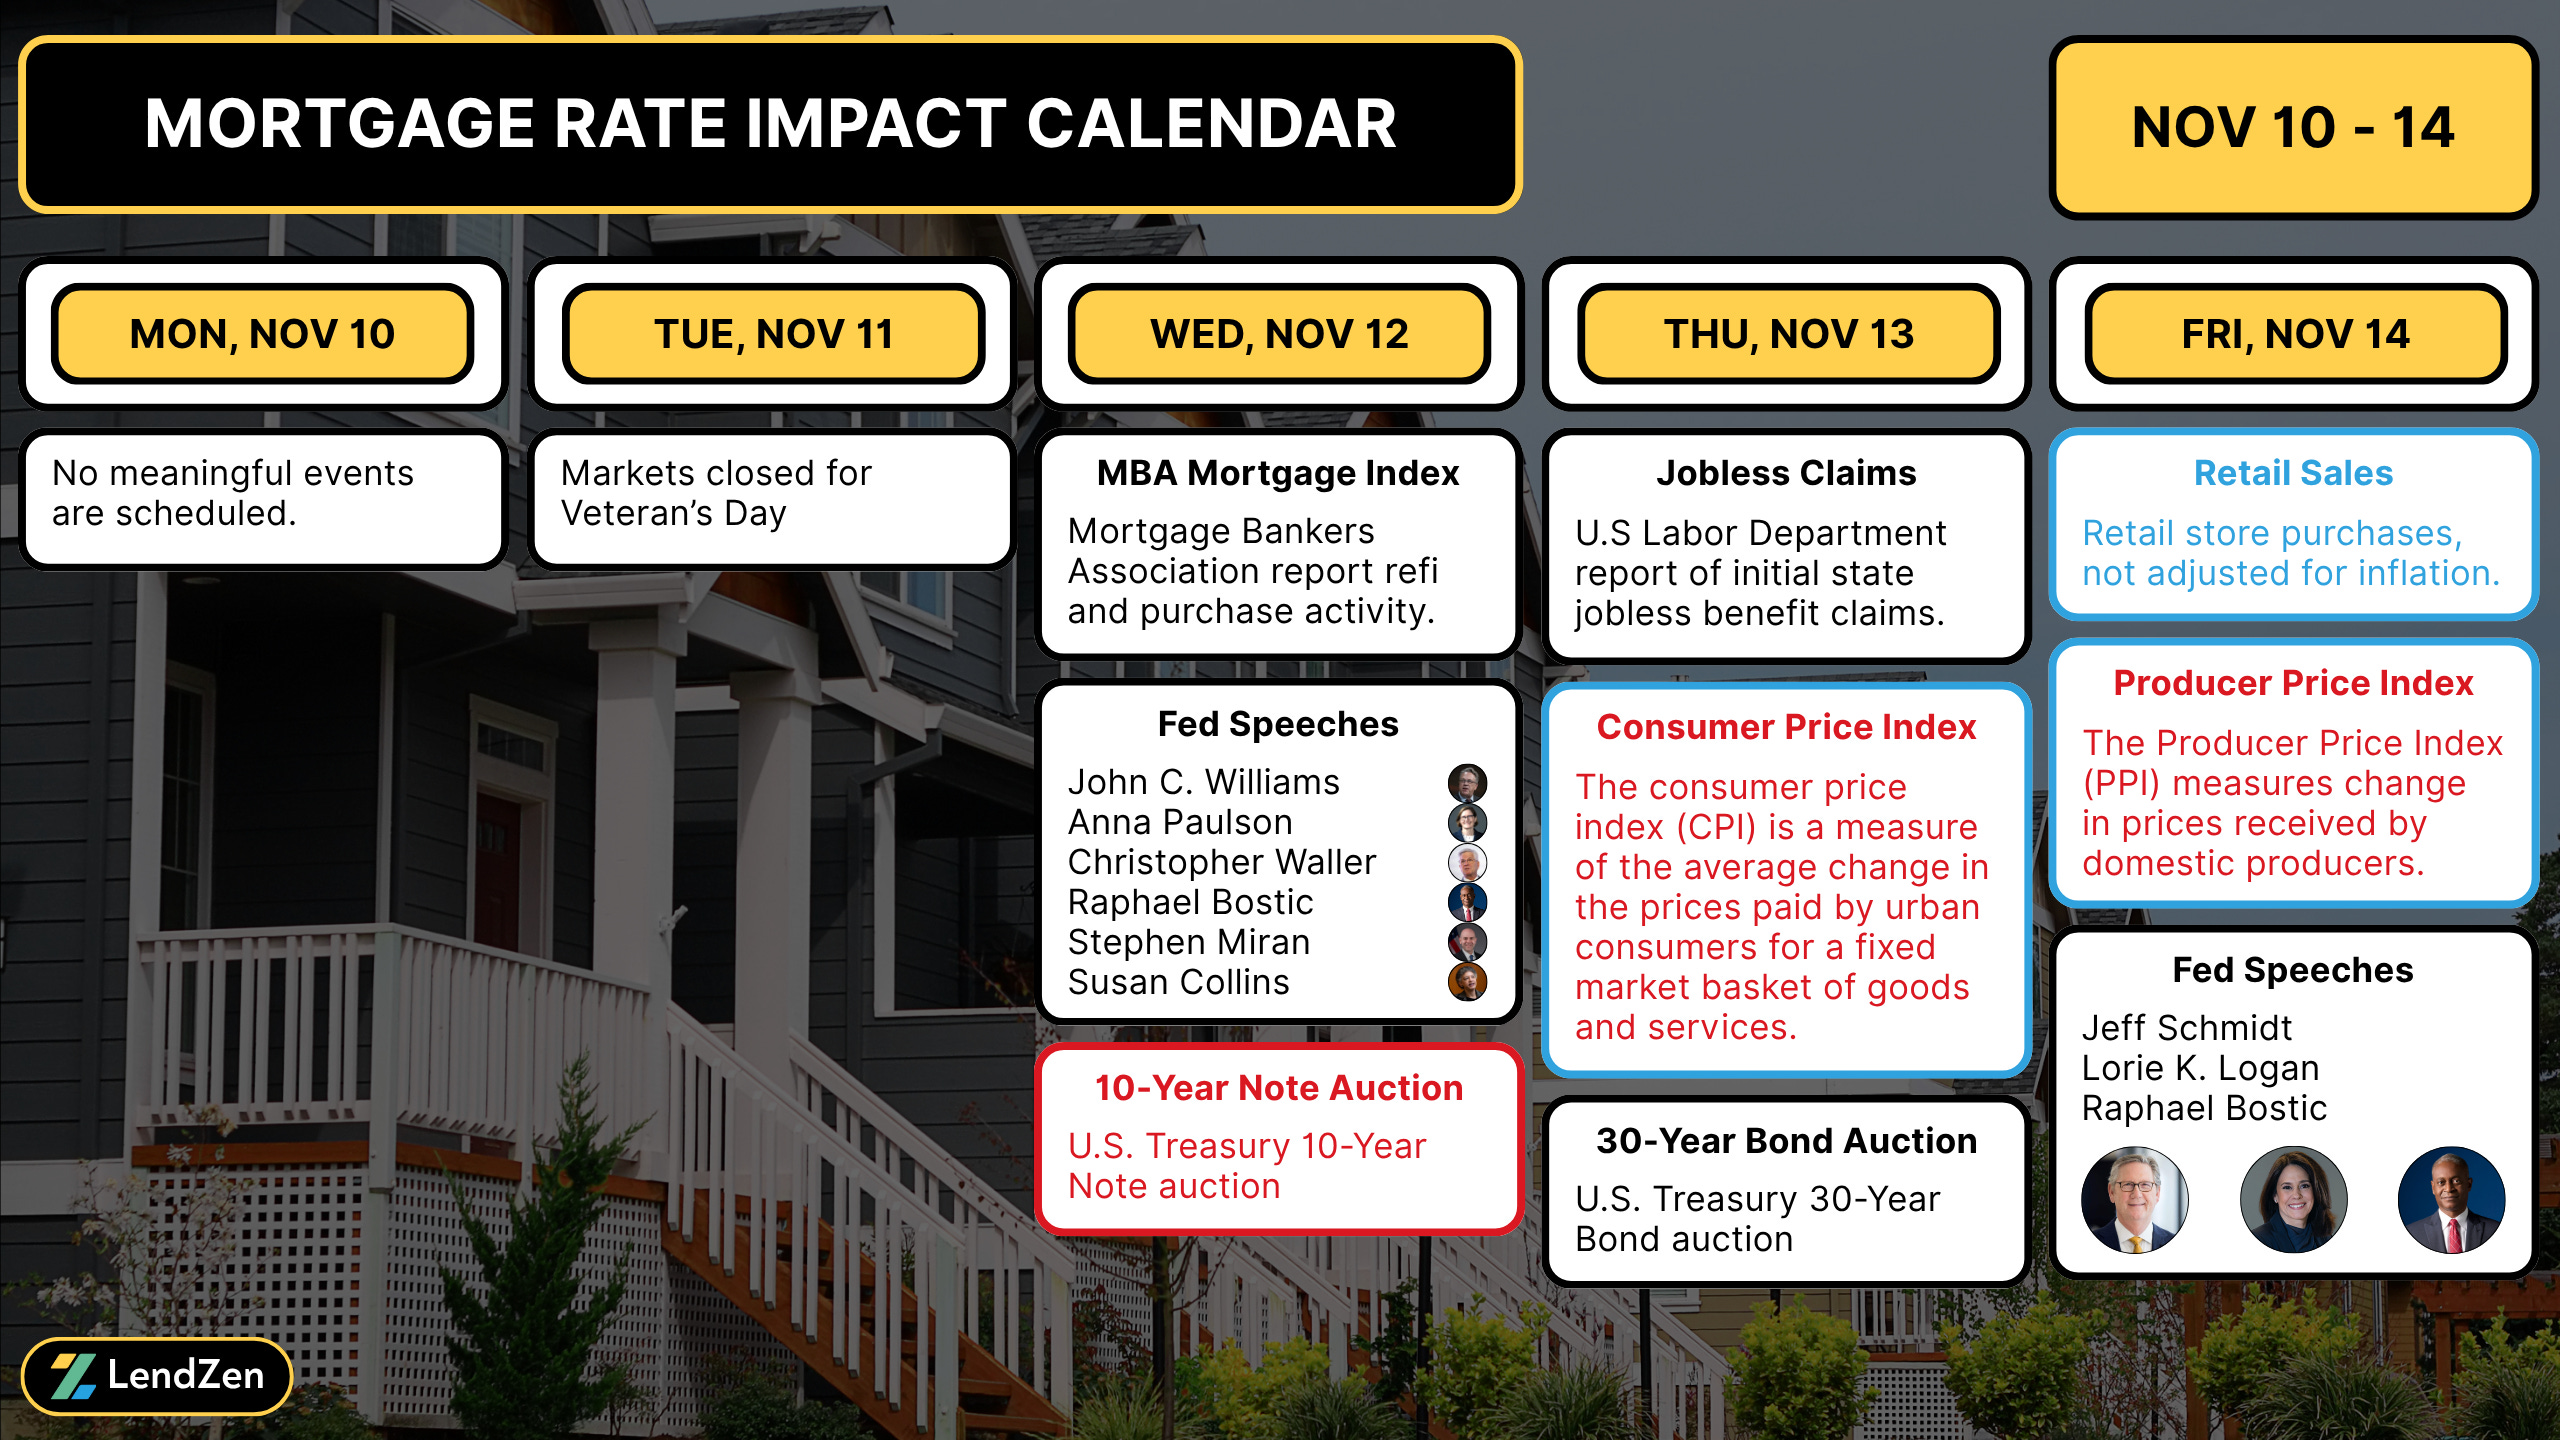
Flying Blind:
If CPI and PPI are delayed again due to the government shutdown traders will continue flying blind. More on the significance of these data sets in yesterday’s Week Ahead.
**Events marked blue could be delayed by the shutdown
Deeper analysis - be sure to read the RATE LOCK GUIDE at the bottom of this post for a more detailed rationale of what could impact mortgage rates in the weeks ahead.
MARKET RECAP 📉
------------------
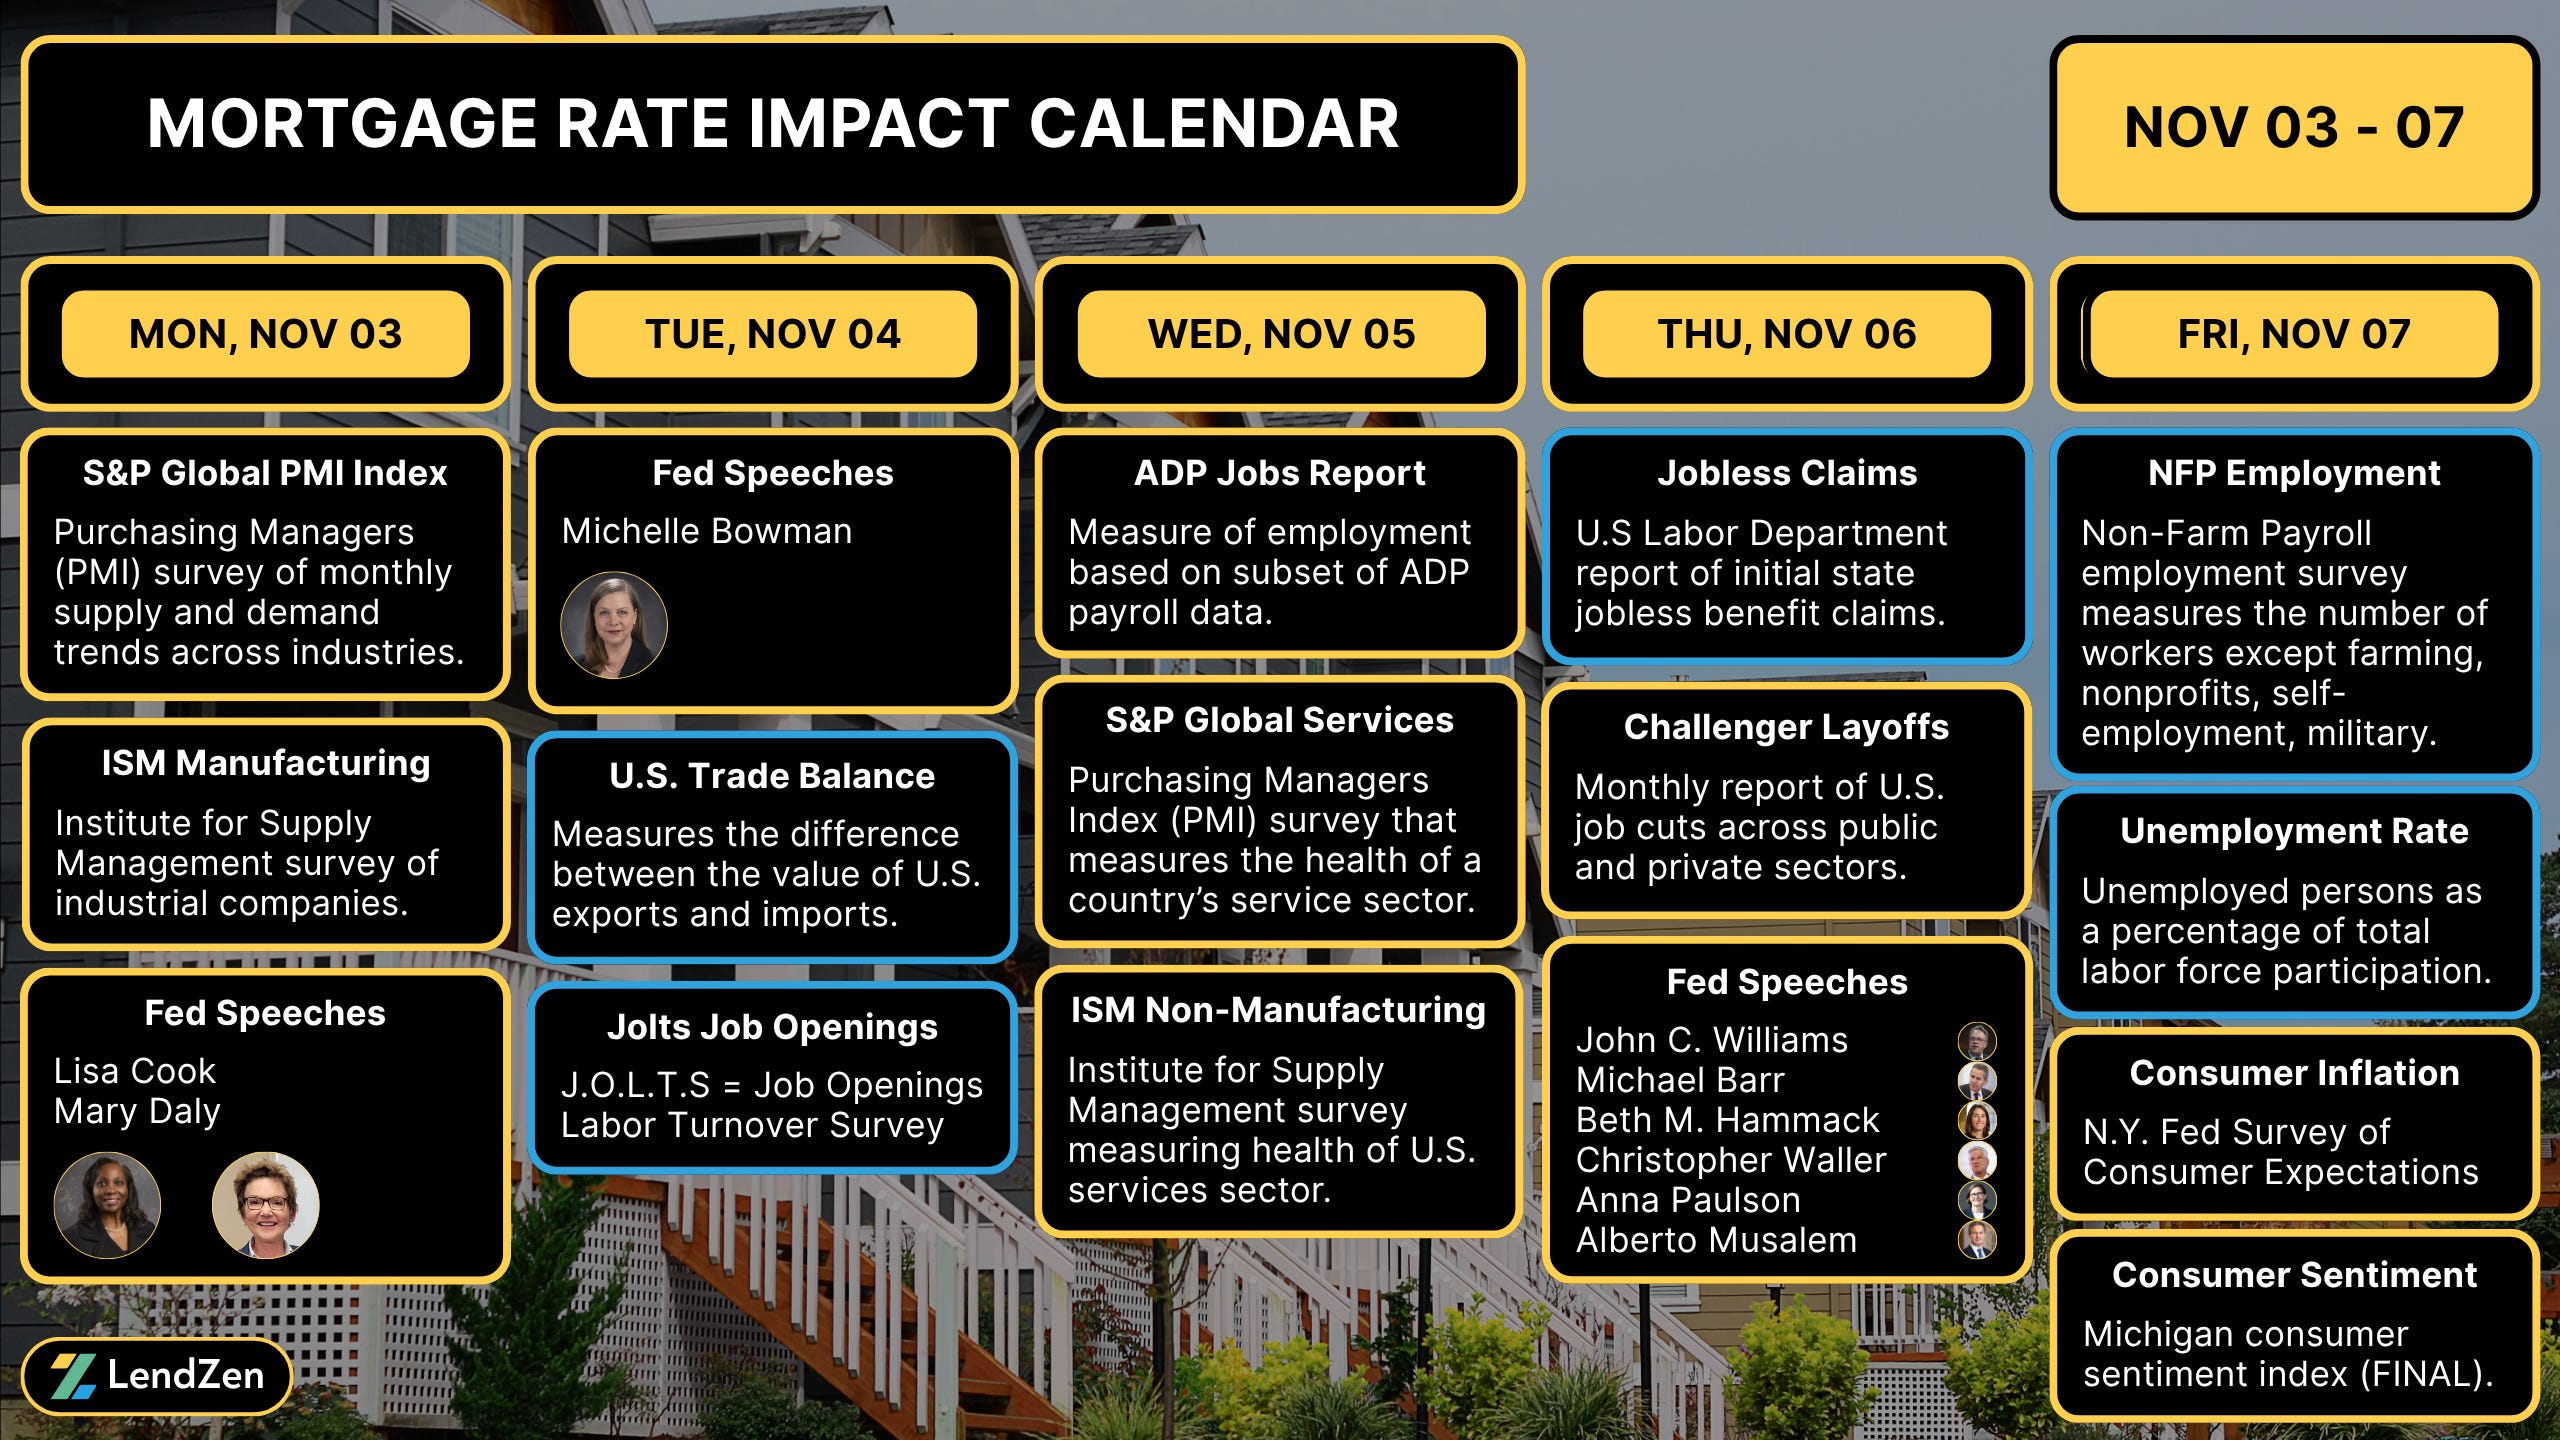
With last week’s most important data (NFP) delayed due to the government shutdown, ADP payrolls and service-sector surveys became the main focus.
The PMI and ISM service industries data was better than expected and caused a midweek bond sell-off.
Fortunately, the “current conditions” consumer sentiment reading was historically low, providing a minor rally on Friday that helped bonds close out the week roughly unchanged.
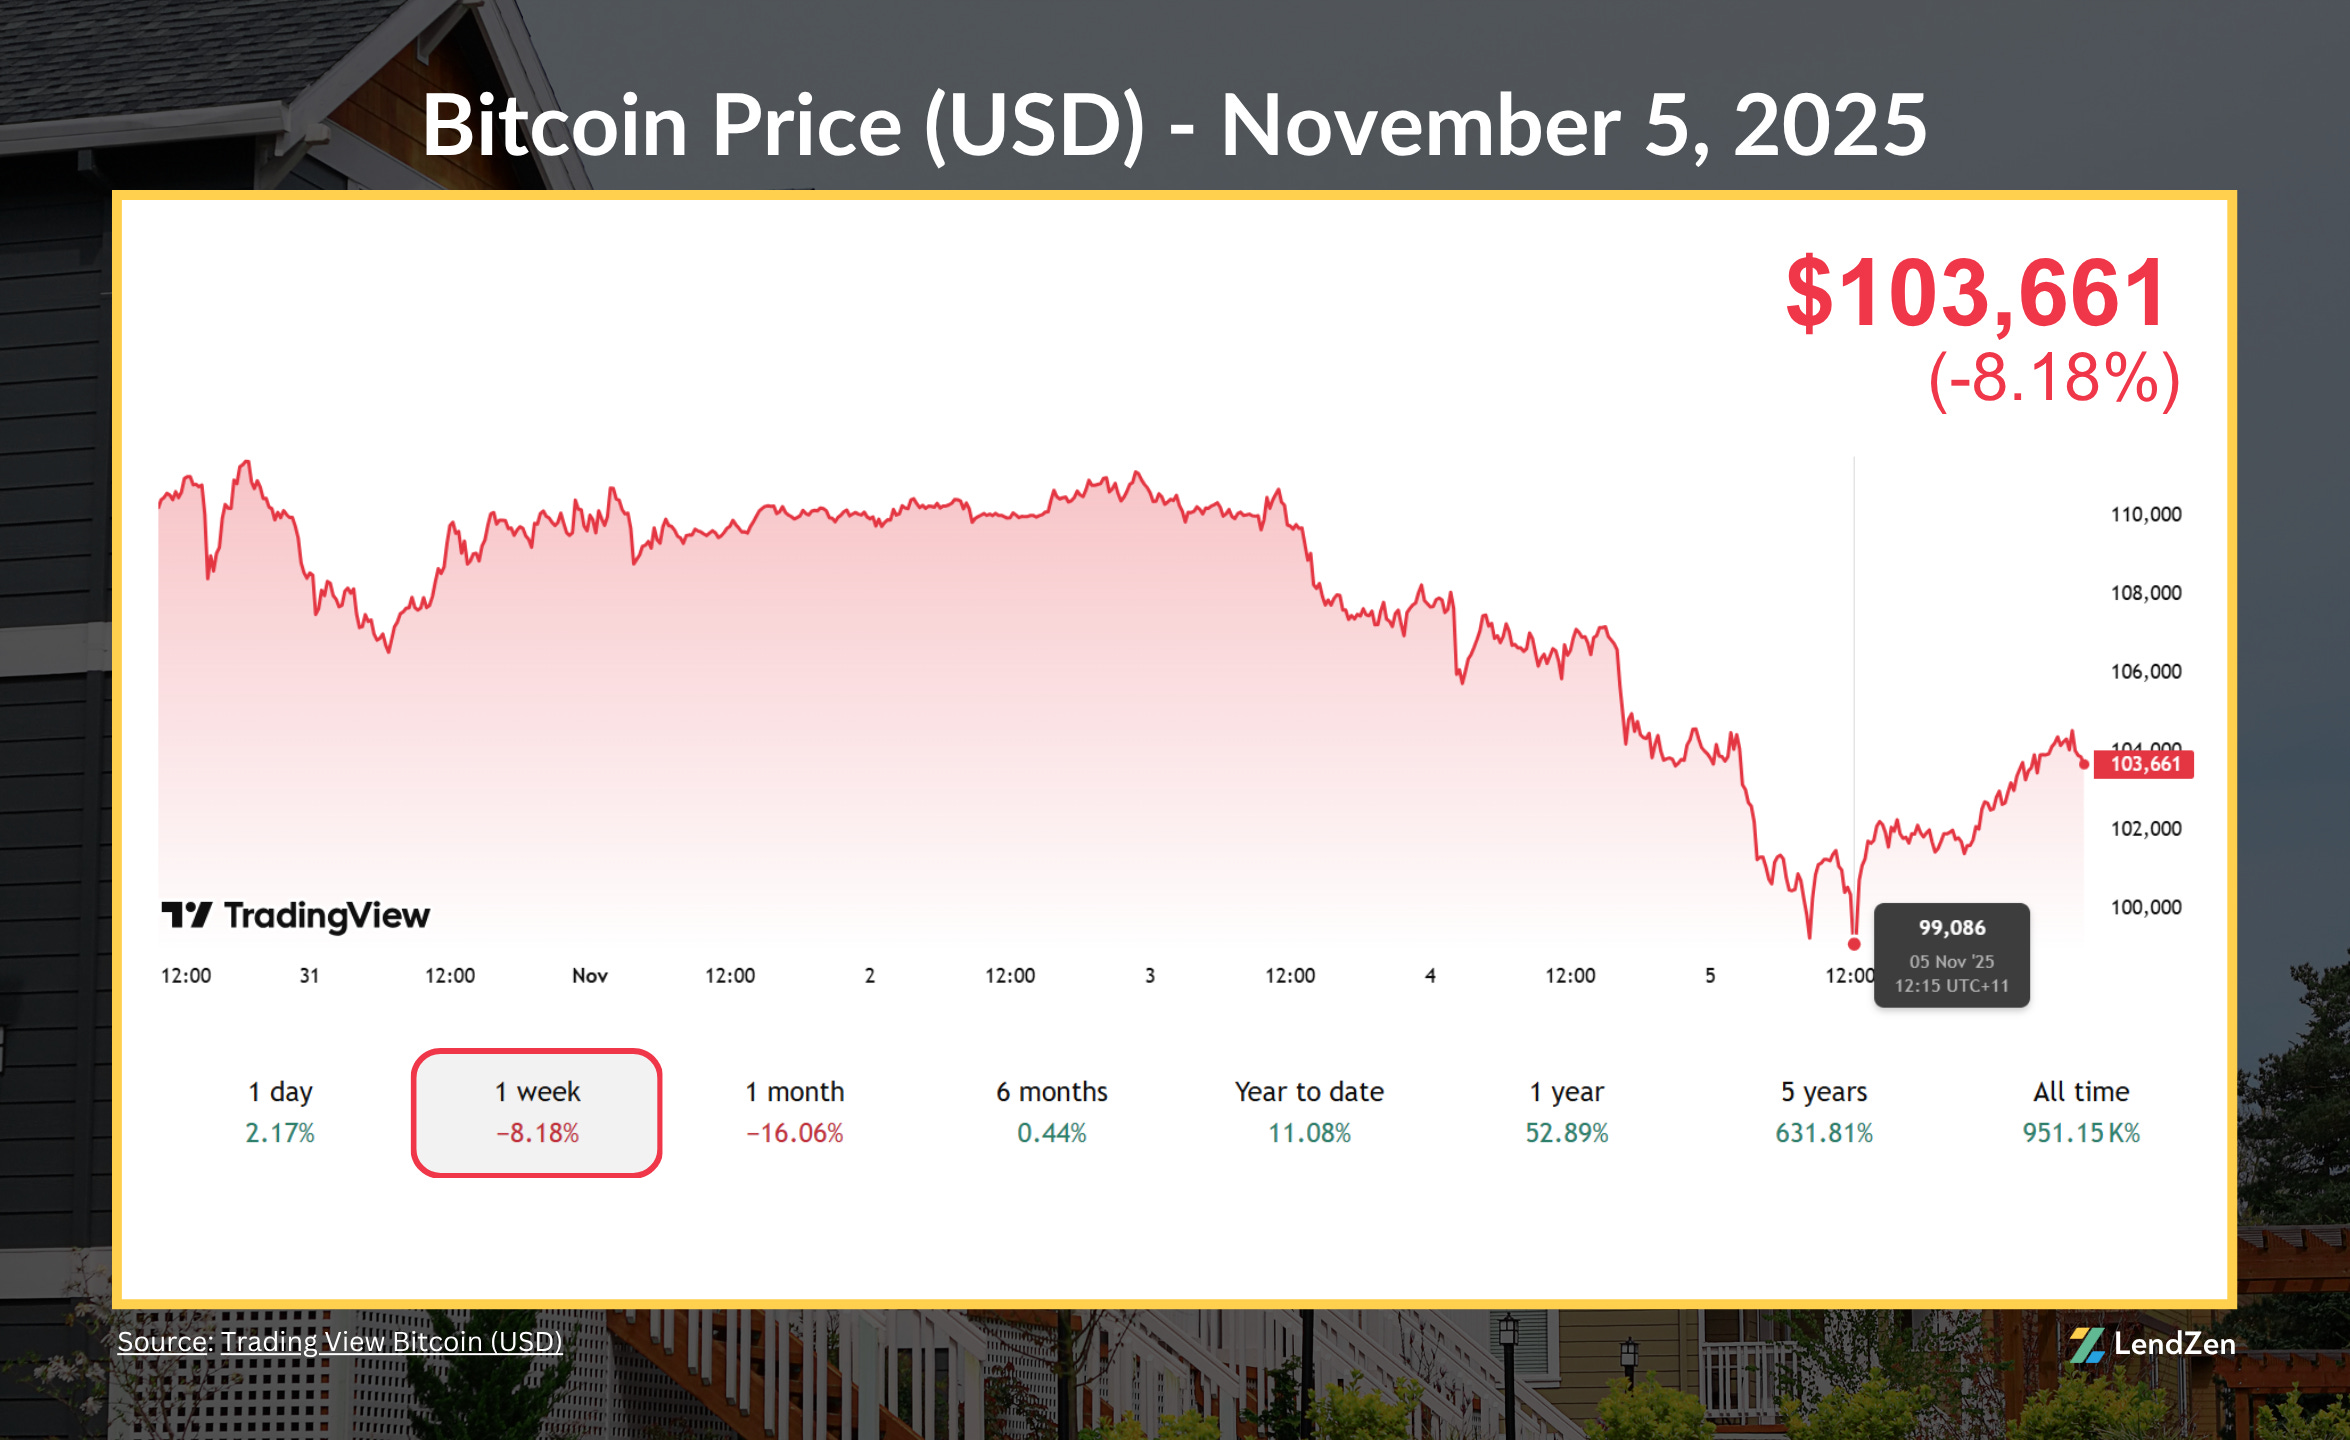
Midweek also saw Bitcoin dip below $100k for the first time since June, but it recovered quickly and continues to hold the line.
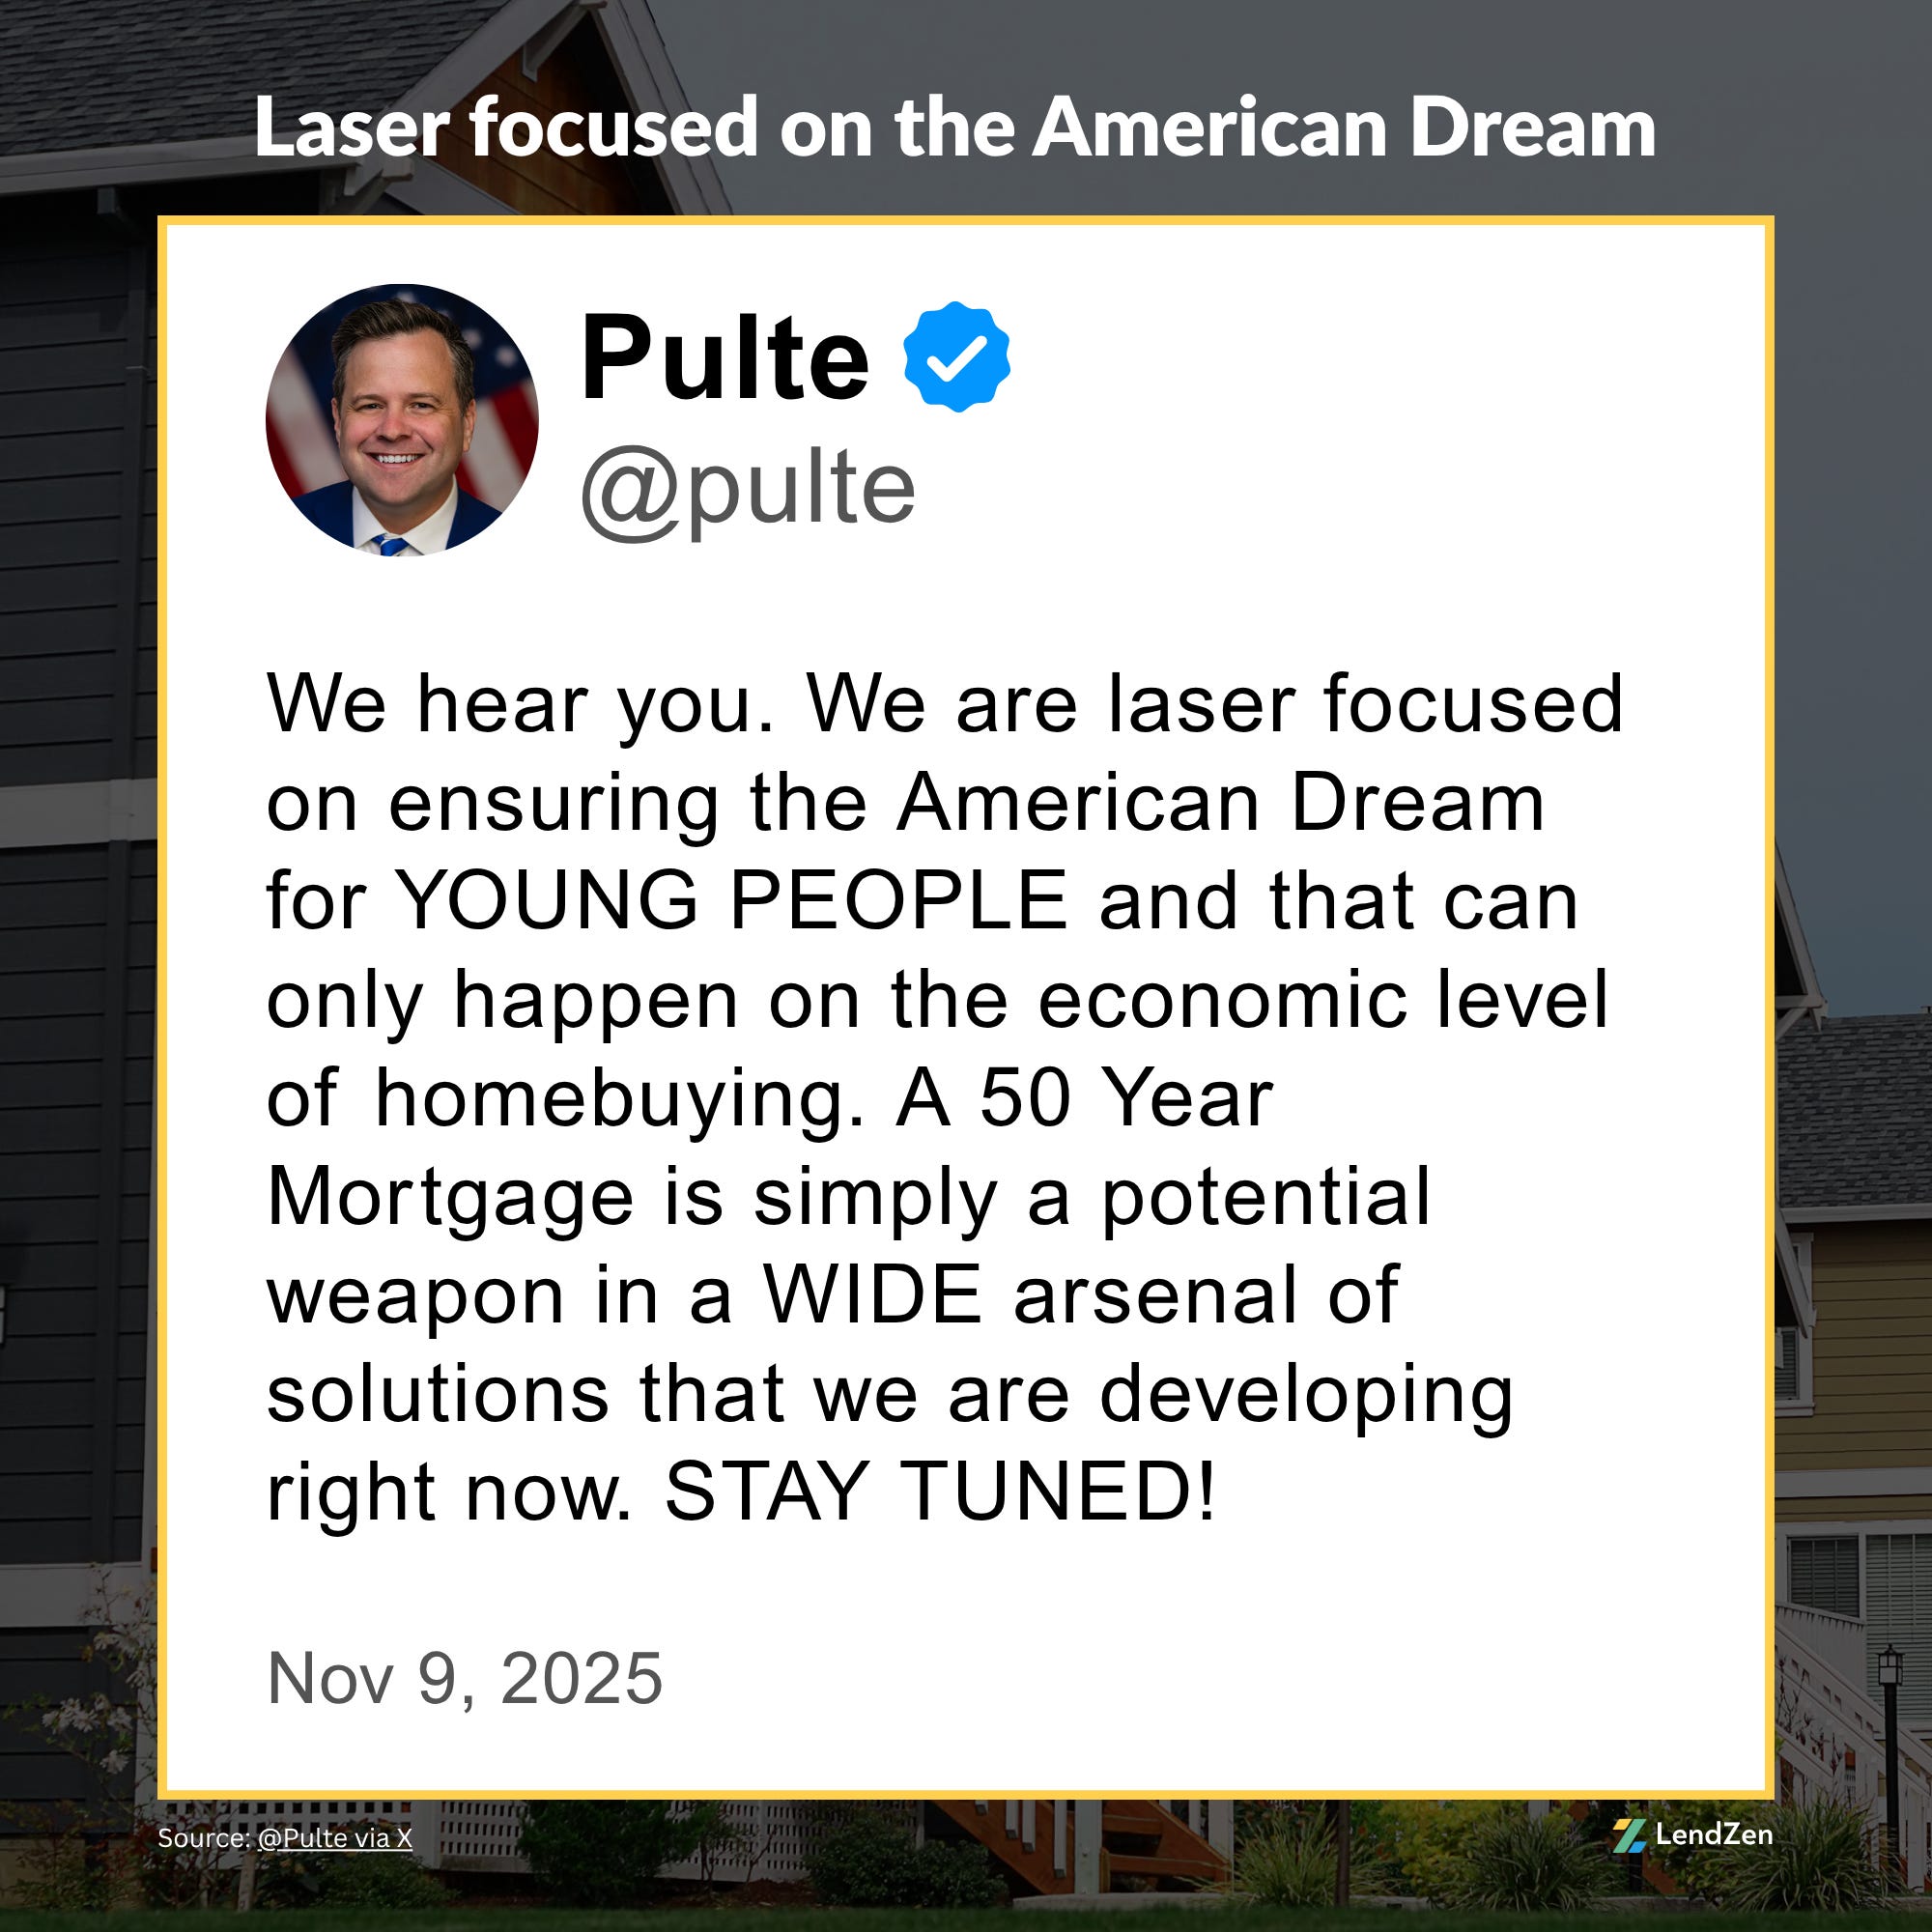
Over the weekend Donald Trump and Fed Housing Director Bill Pulte hinted that “we are indeed working on The 50 year Mortgage.”
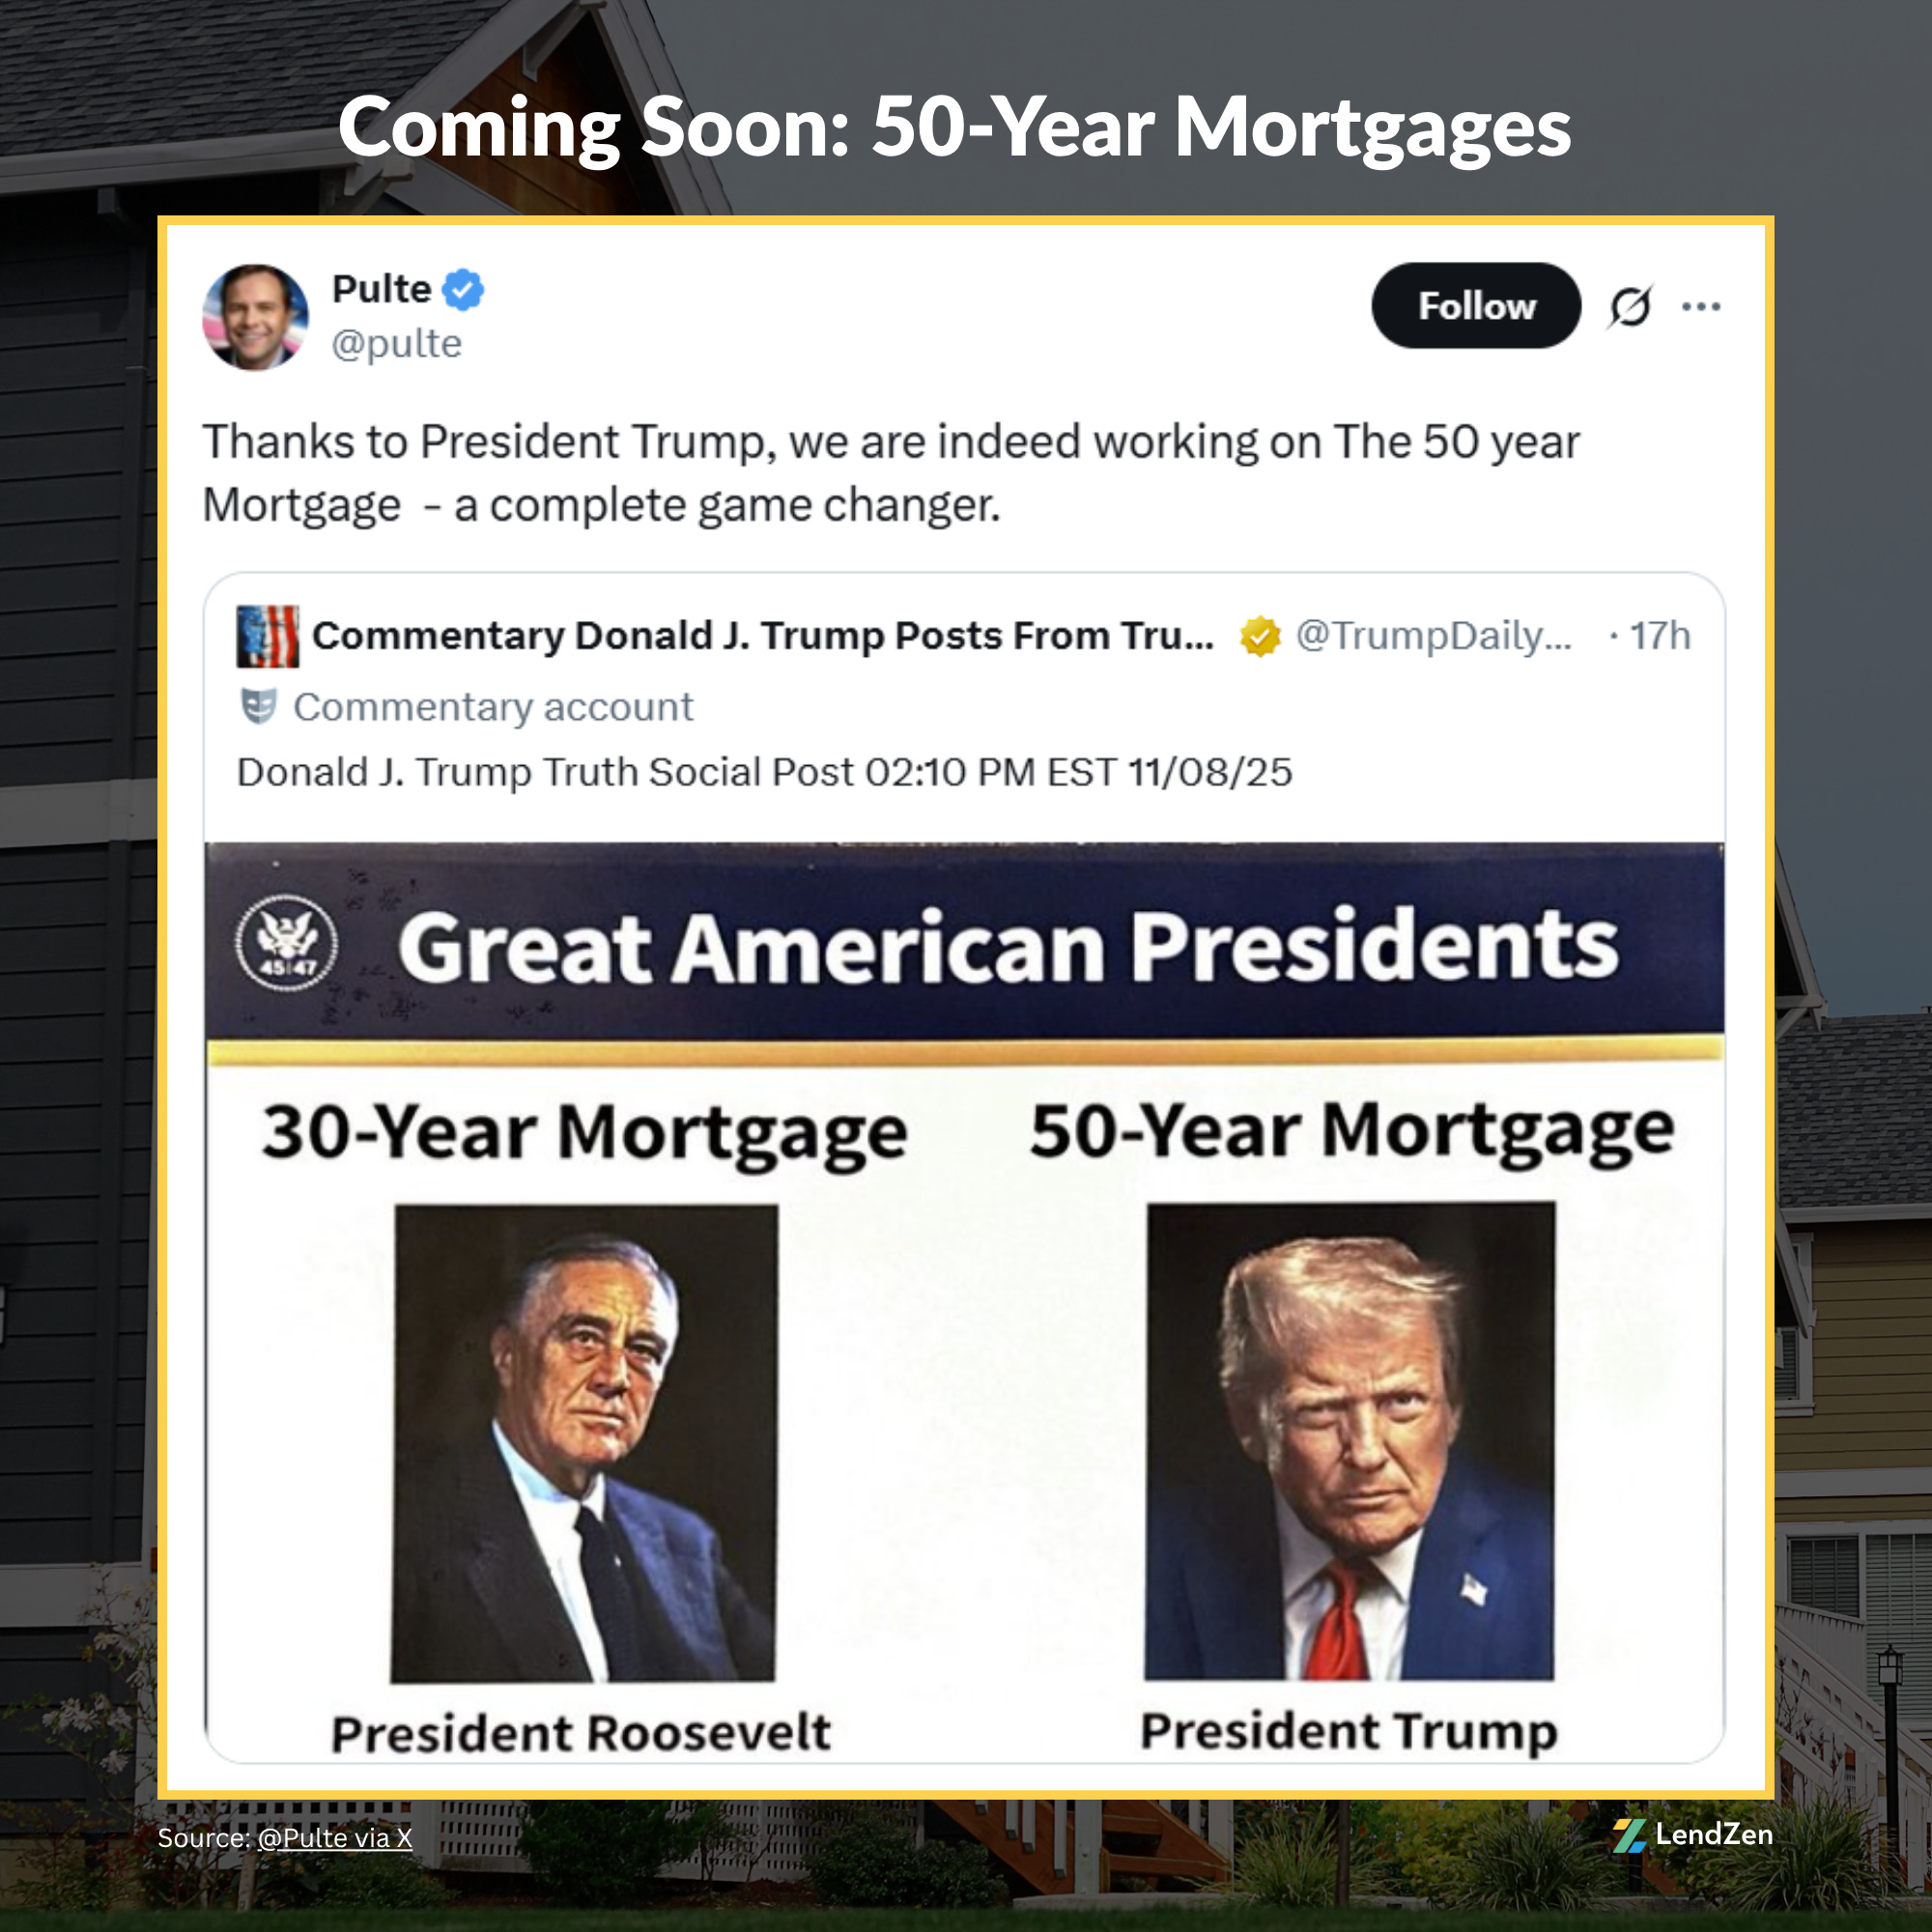
The topic is expected to continue drawing heavy debate, even if it is just a “weapon in a wide arsenal of solutions”. 🤥
In the meantime, discussions around the 50-Year Mortgage presented a great opportunity for “finance experts” to blame Blackrock for the housing affordability crisis.
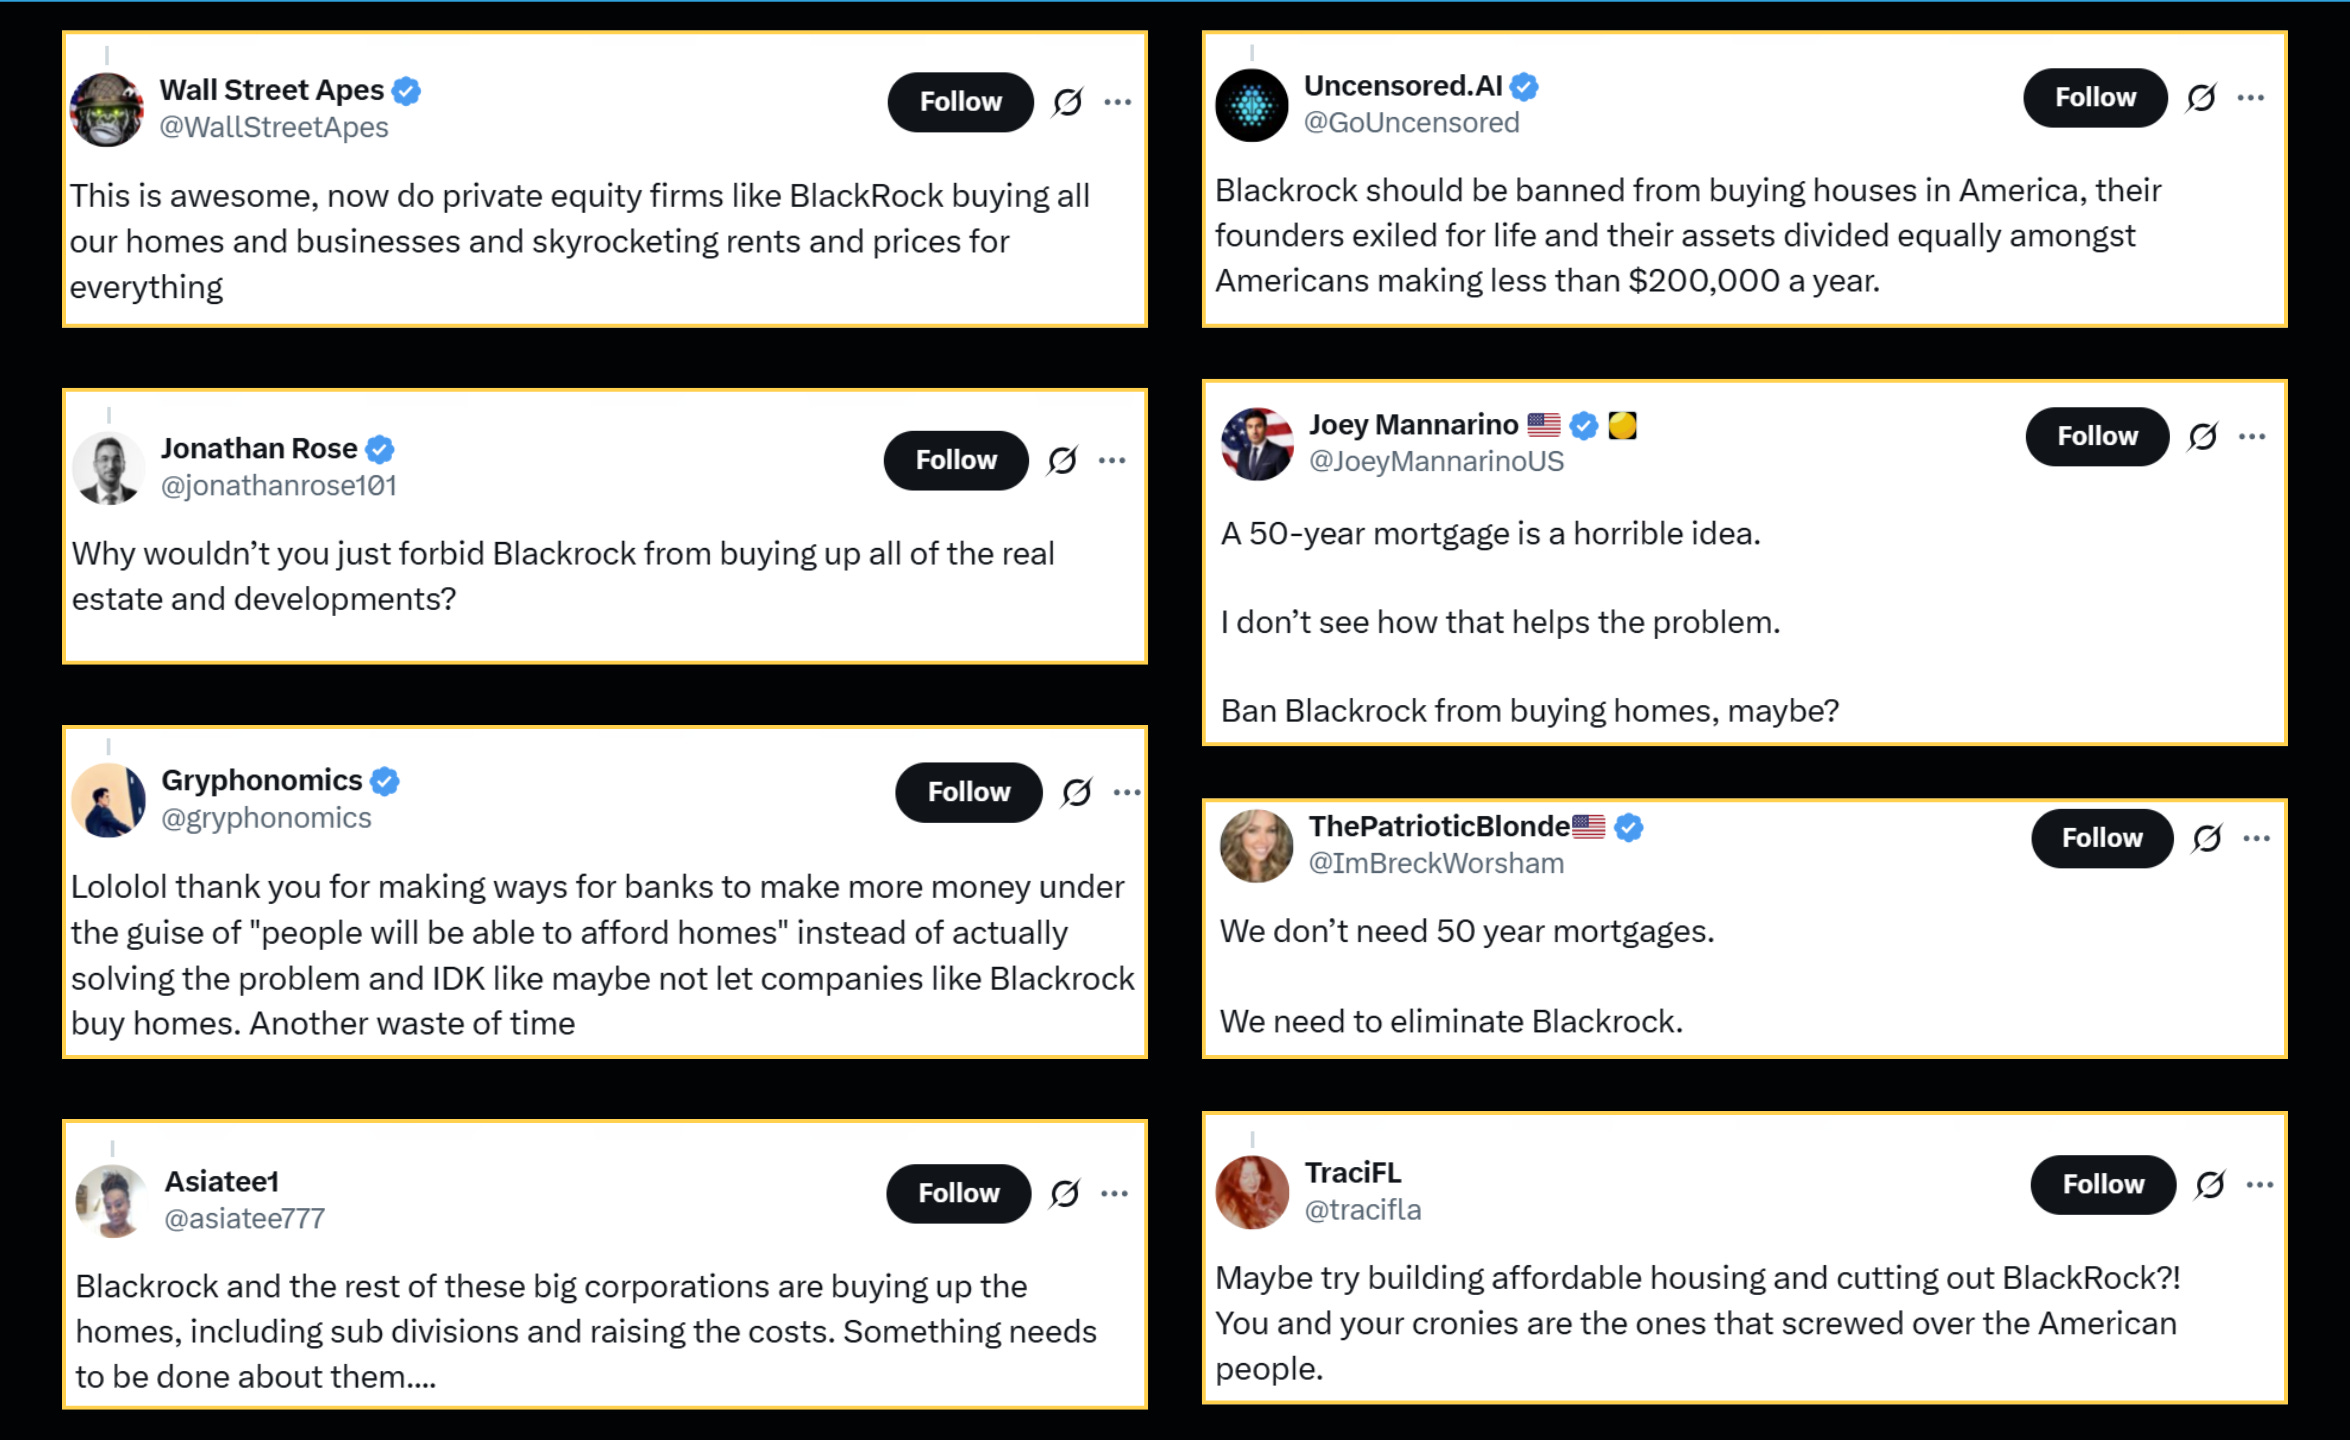
Unfortunately, the Scooby Doo Squad above have the wrong villain.

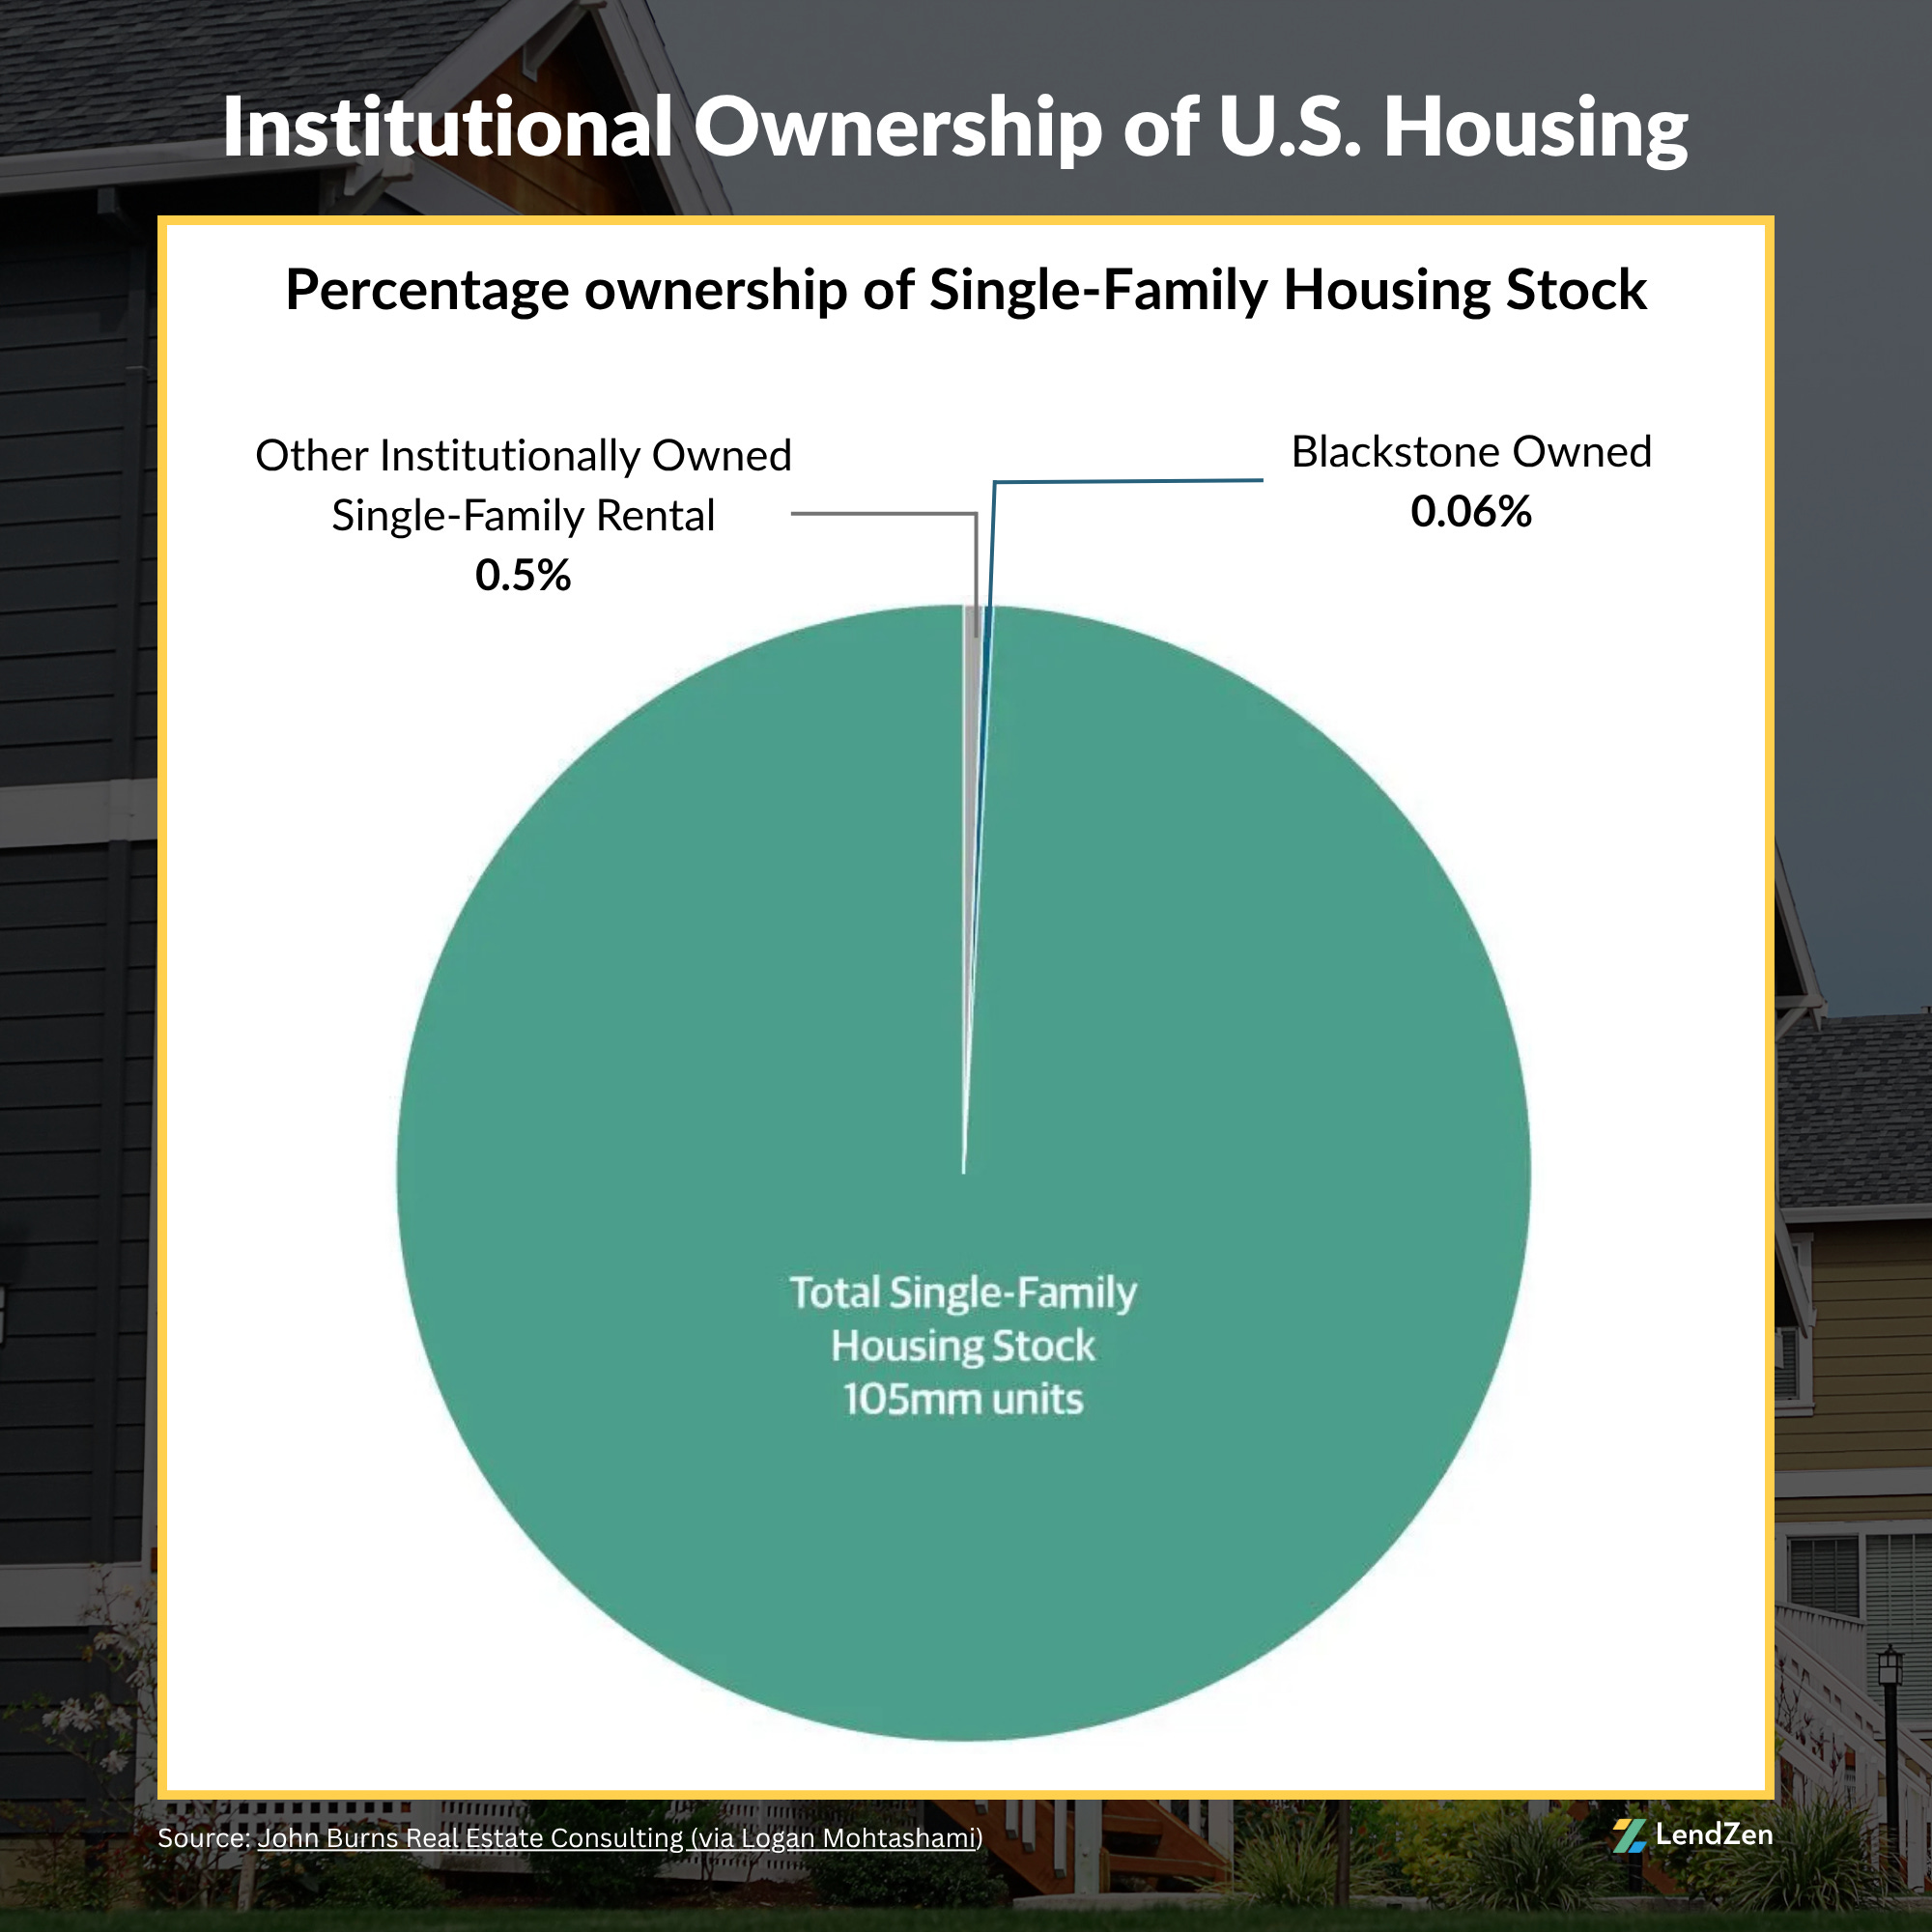
Regardless, the “Blackstone is buying up all the homes” narrative has already been debunked.
MORTGAGE RATE PRICES 📉
------------------------------
Mortgage rates do not rise or fall, instead the PRICE of rates change.
The LendZen Index calculates a daily change in the price of mortgage rates by tracking a spectrum of mortgage-backed securities (MBS).
This provides borrowers with a more specific measurement of how the cost to obtain a mortgage is changing, regardless of the lender, rate, or credit score.
The index is posted daily at LendZen.substack.com
-------------
11/07/2025
-------------
24-Hour: -2 bps (-$21 per $100K)
5-Day: +6 bps ($58)
10-Day: +38 bps ($382)
30-Day: -9 bps (-$90)
60-Day: -93 bps (-$927)
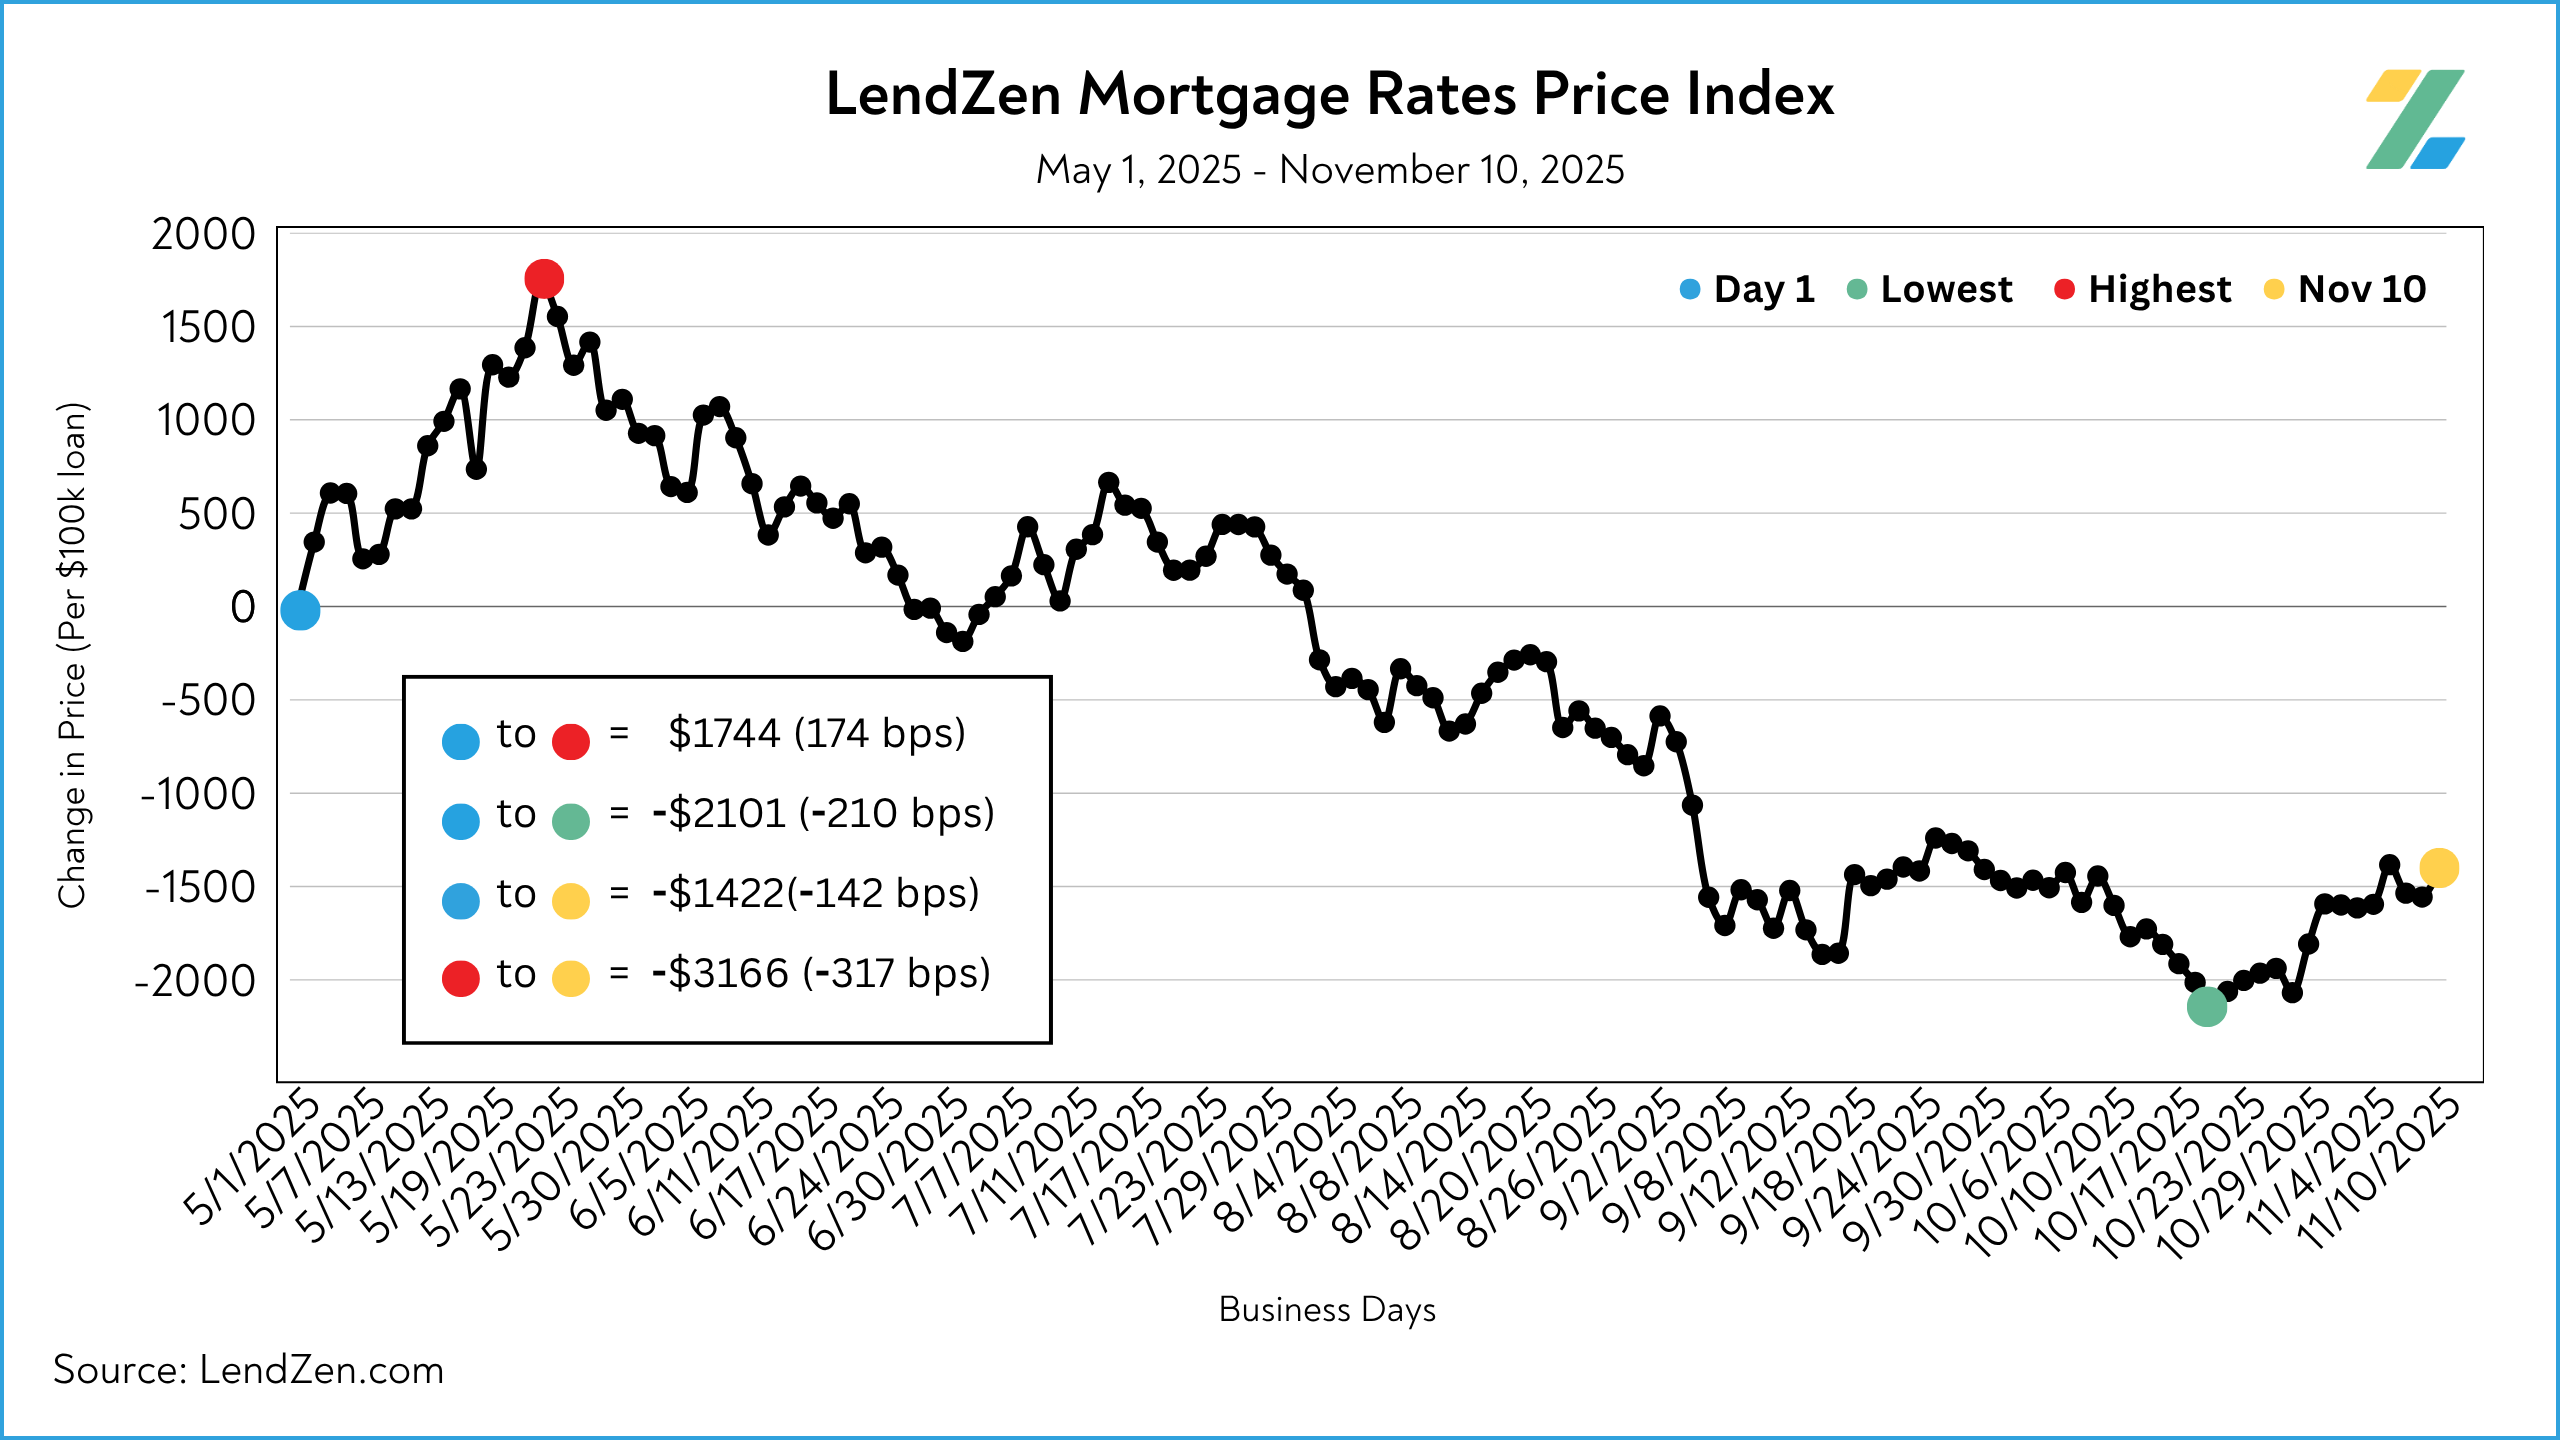
Since July 15: -222 bps (-$2,221 less expensive per $100K)
Despite the midweek scare, mortgage rate prices ended the week relatively unchanged.
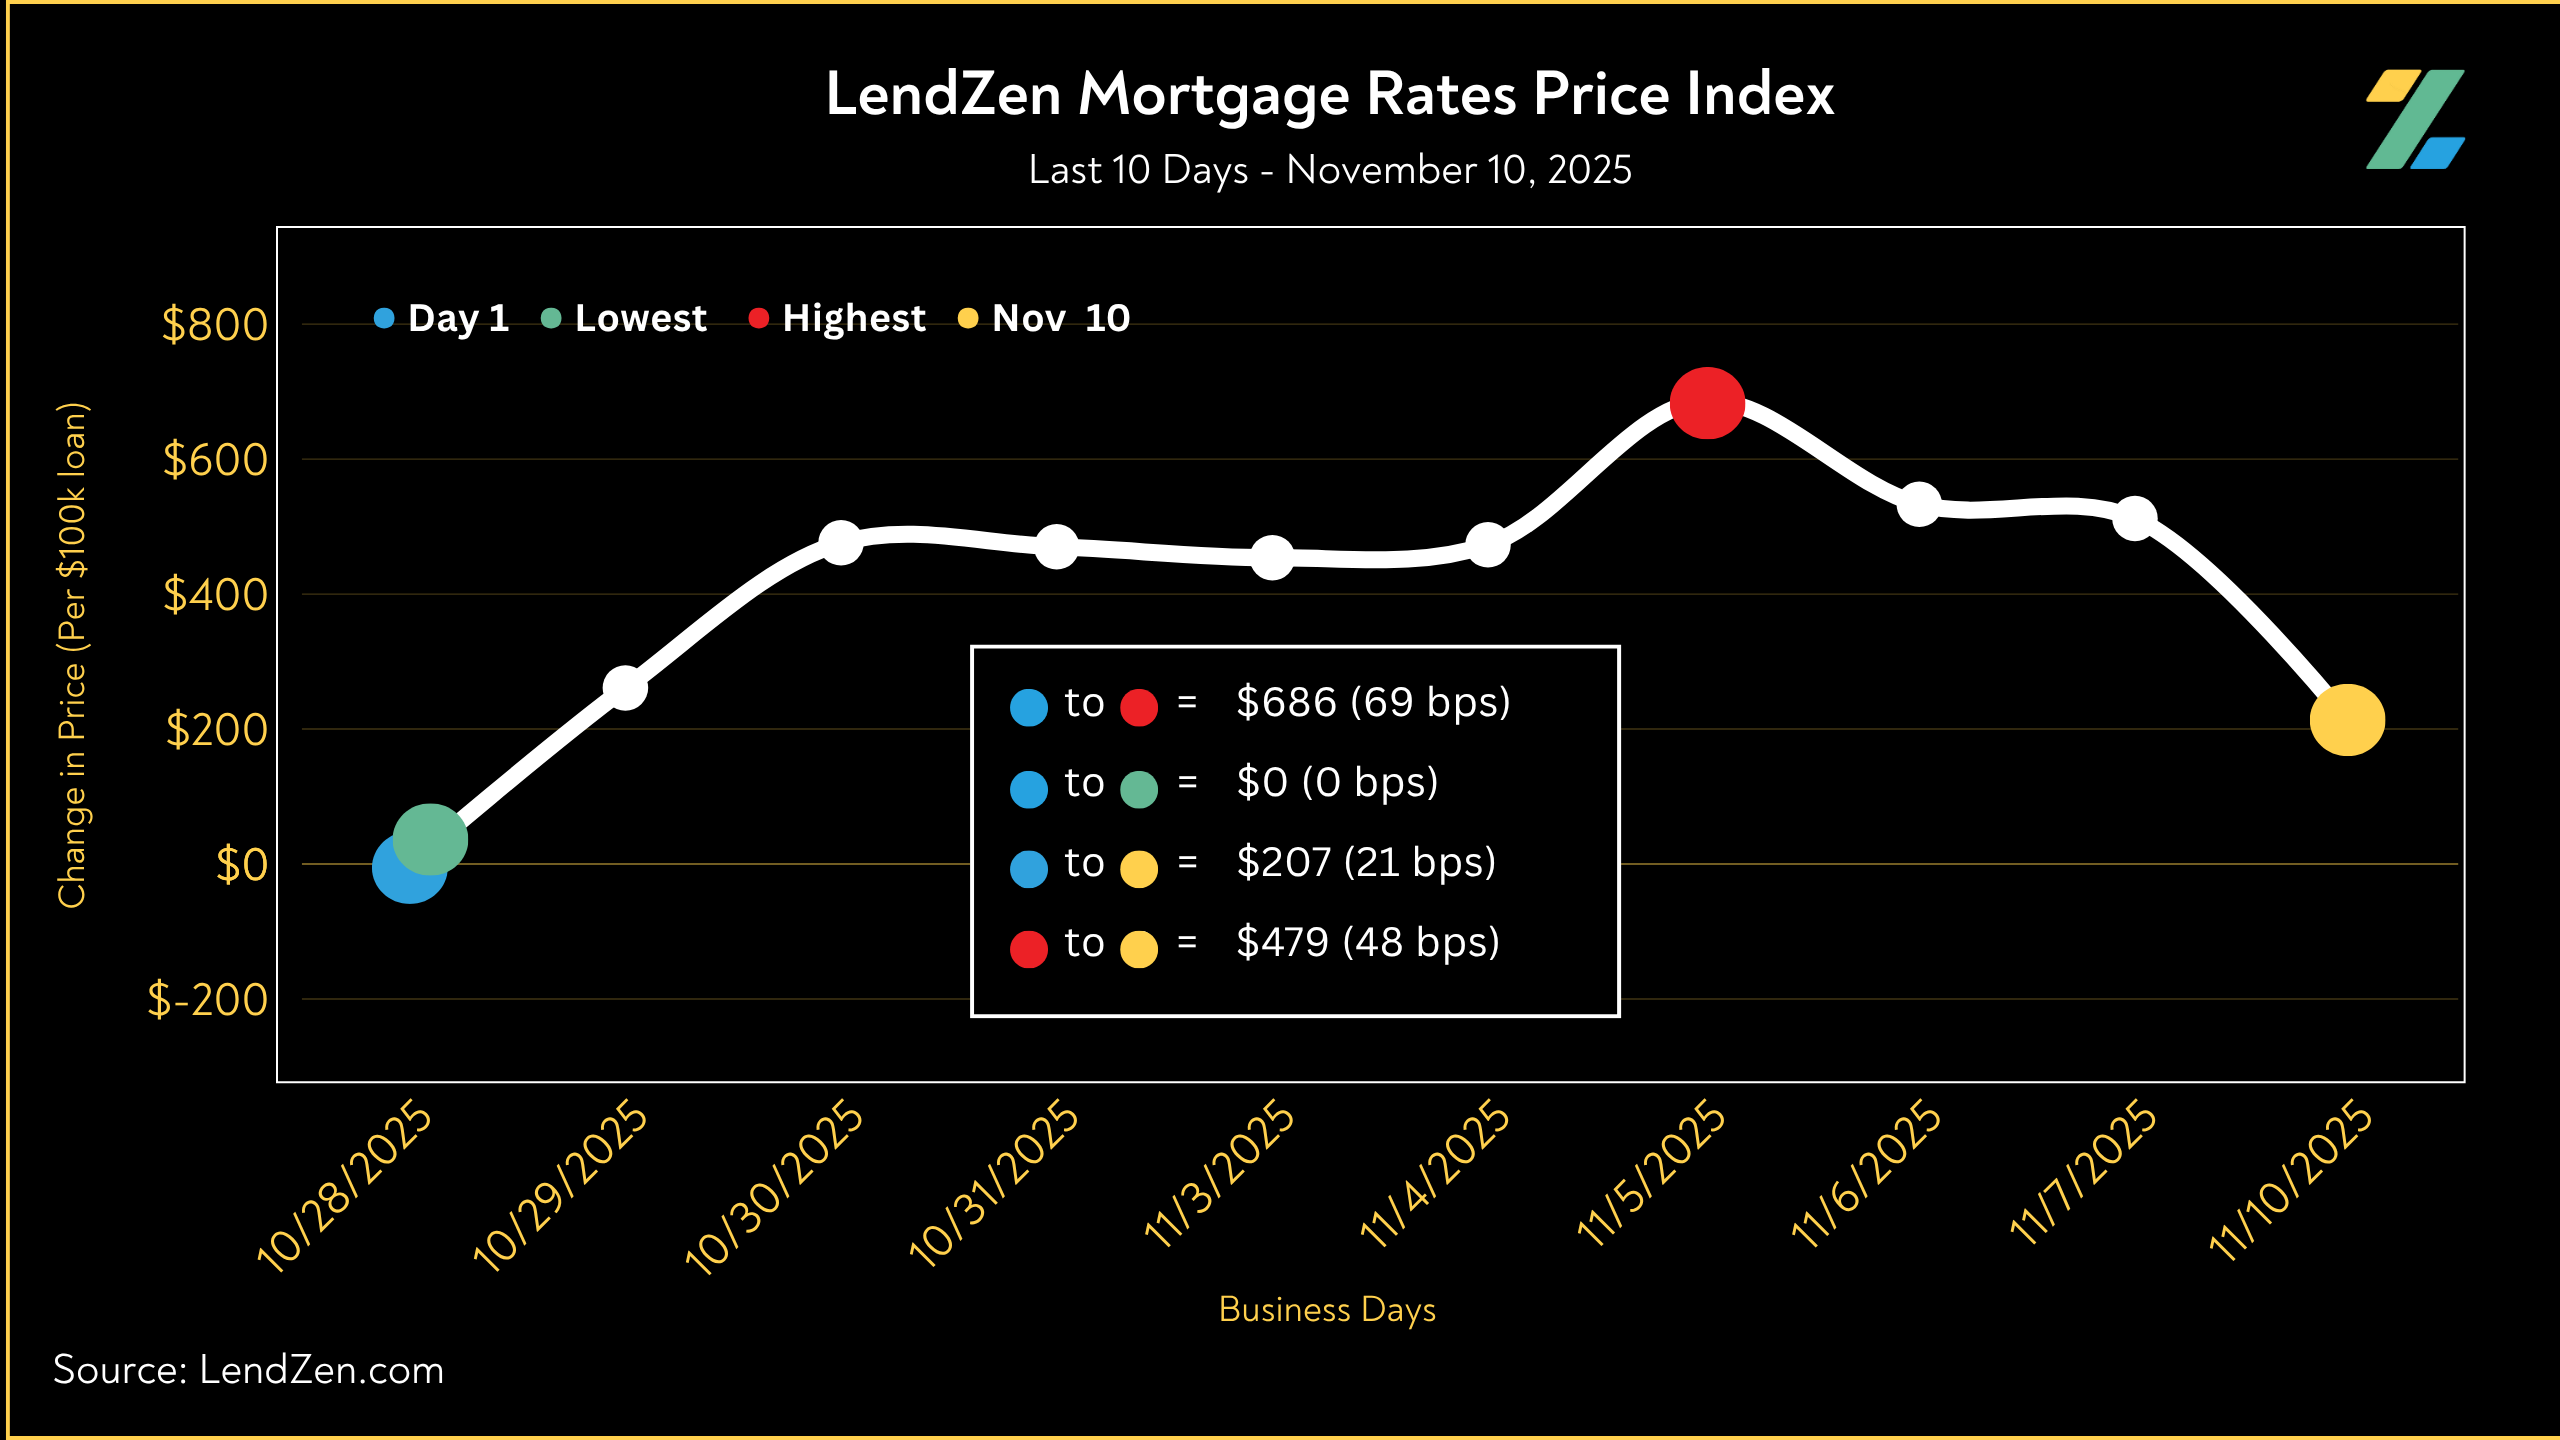
The Friday recovery also kept things nil over the last 30 days, even though we lost 54 basis points since October 21.
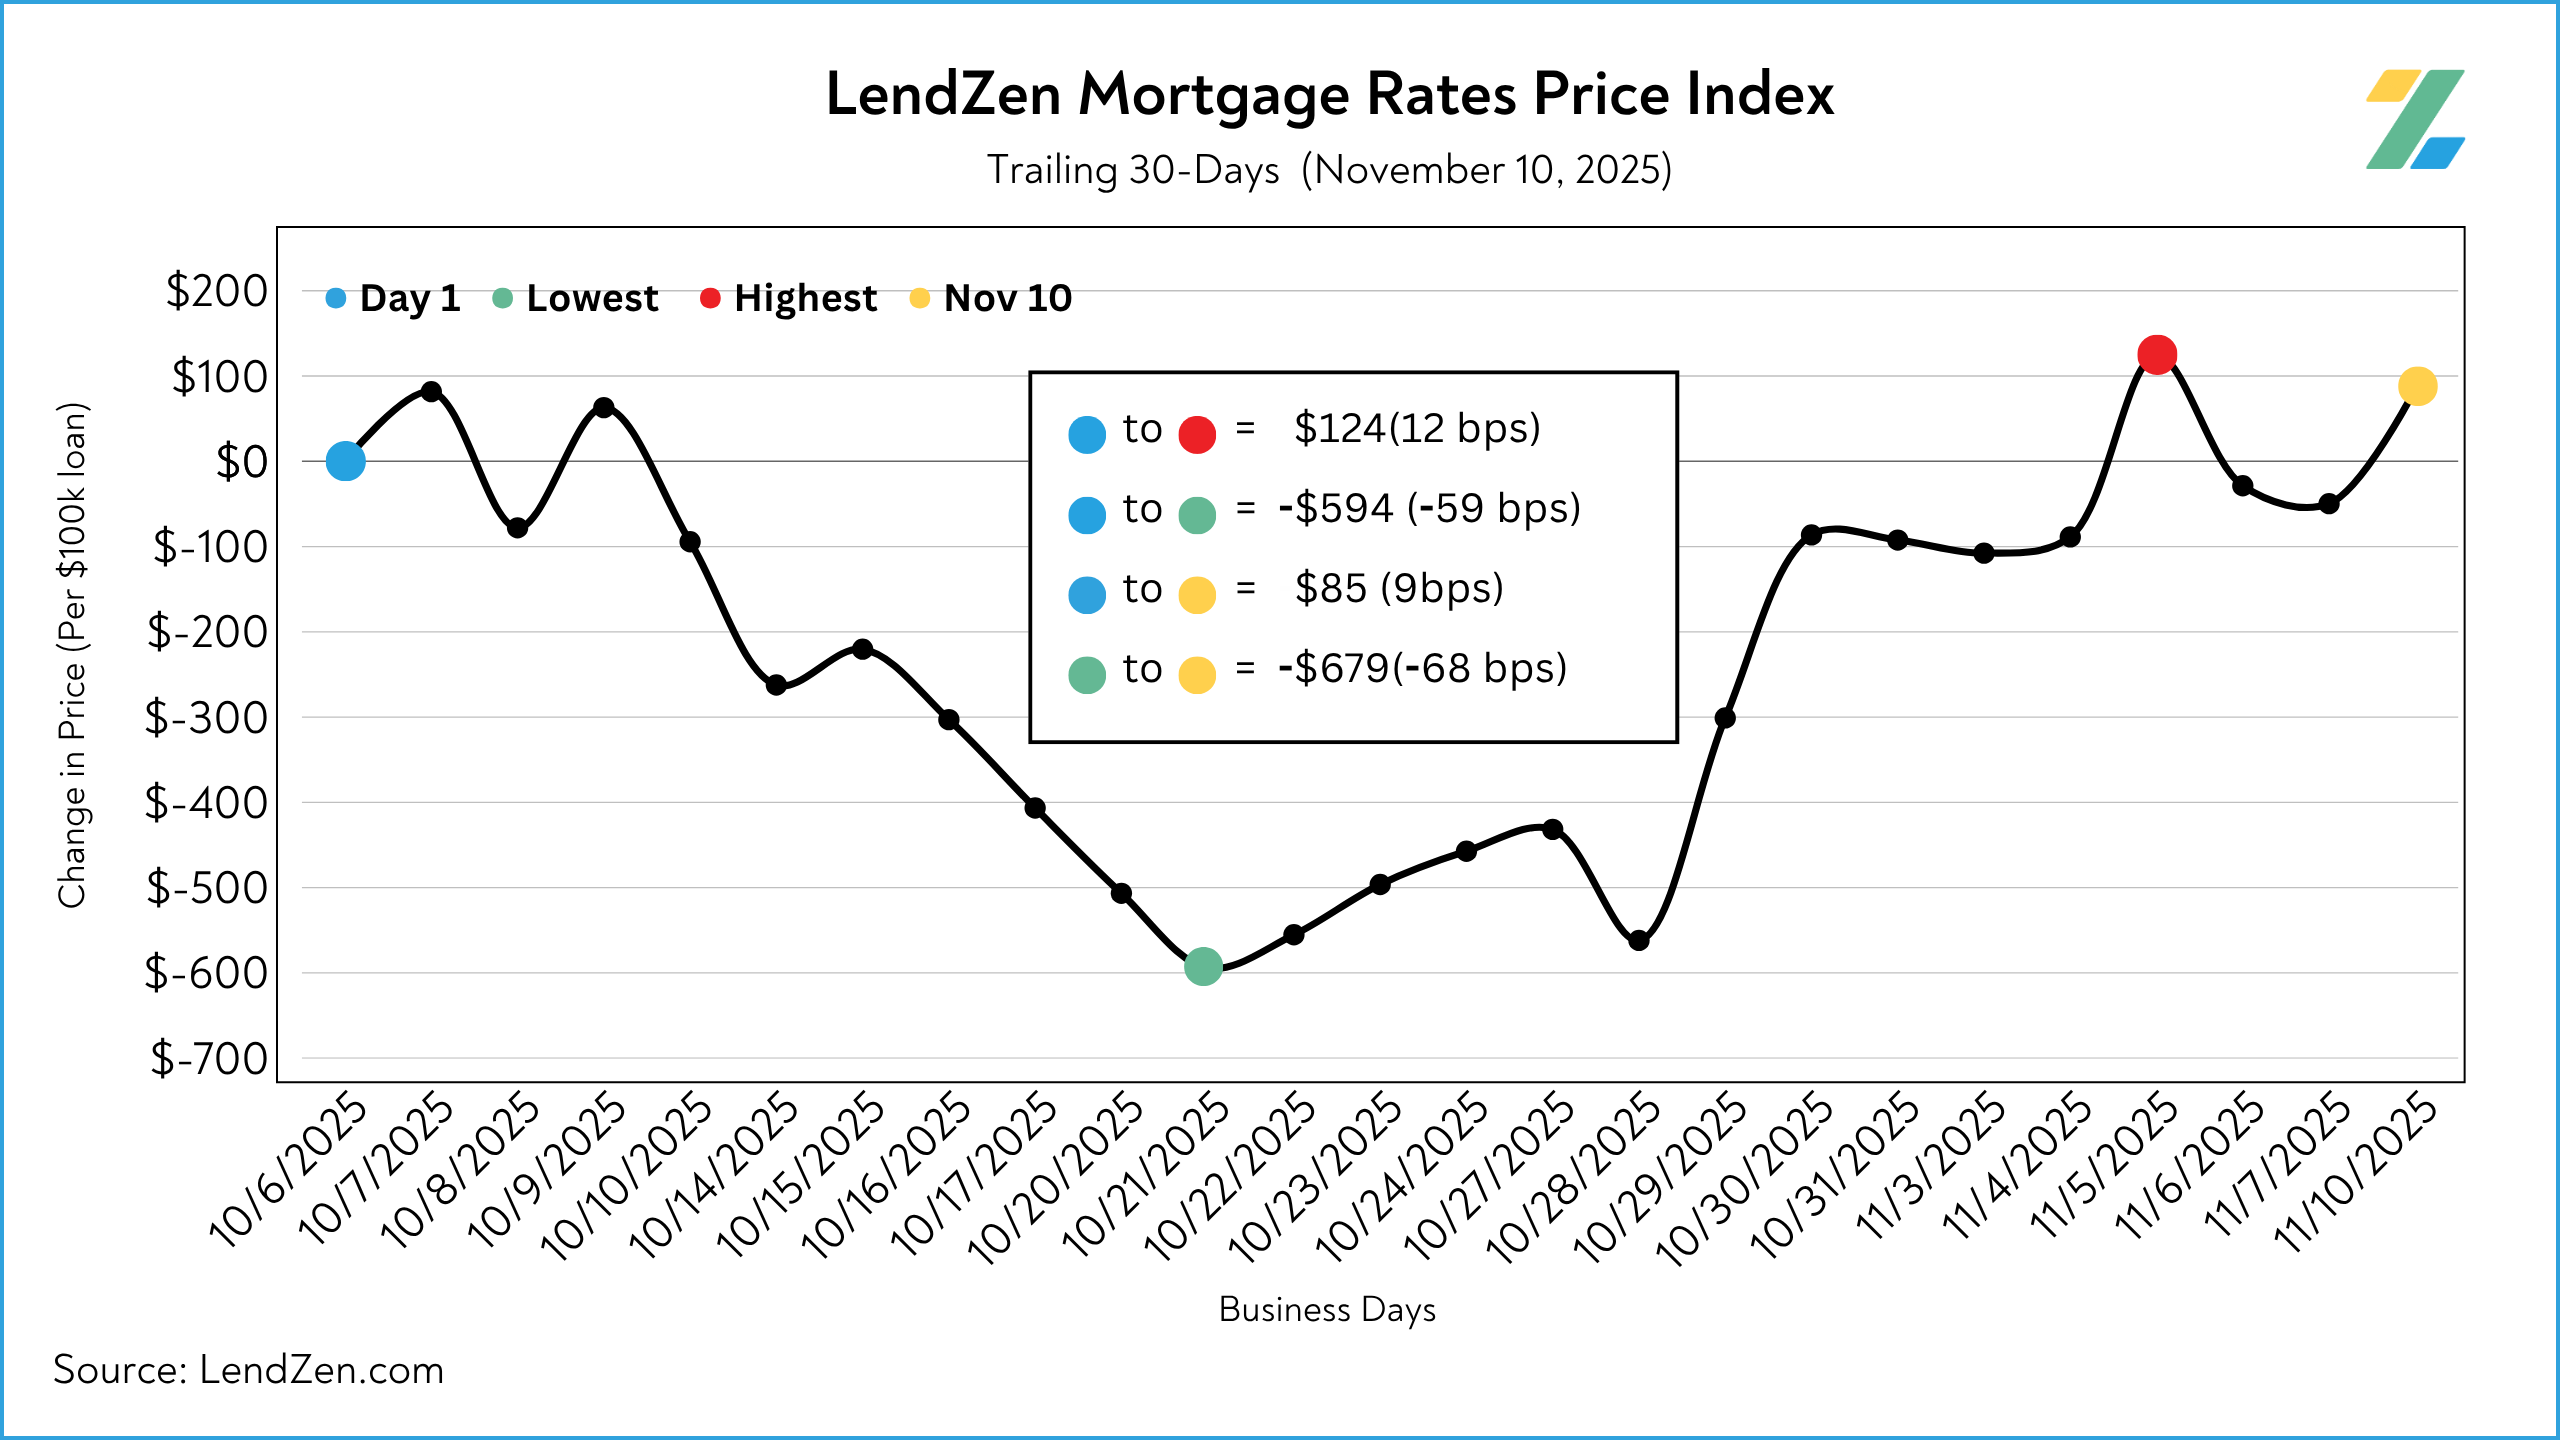
The longer-term trend since this Spring is still intact, giving us hope that this is just another pullback on the way towards even lower mortgage rate prices.
The LendZen Index monitors the change in price across a broad set of rates and mortgage bond coupons, whereas the LendZen Mortgage Rate Price Tracker is more “rate and loan program” specific.
Both are an example of how mortgage rates do not rise or fall, but instead it is their price that changes.
Since the LendZen Index has a variety of time series, the MRPT will focus on just the current month’s activity.
You can explore the results from November Week 1 on this Substack post.

MORTGAGE SPREADS 🧈
-------------------------
Published daily with the LendZen Index is the LendZen Mortgage-Treasury Spread.
The LMTS uses actual bond yields to create a historically consistent, and reliable, data set.
Learn more about the importance of accurately calculating spreads on this Substack post.
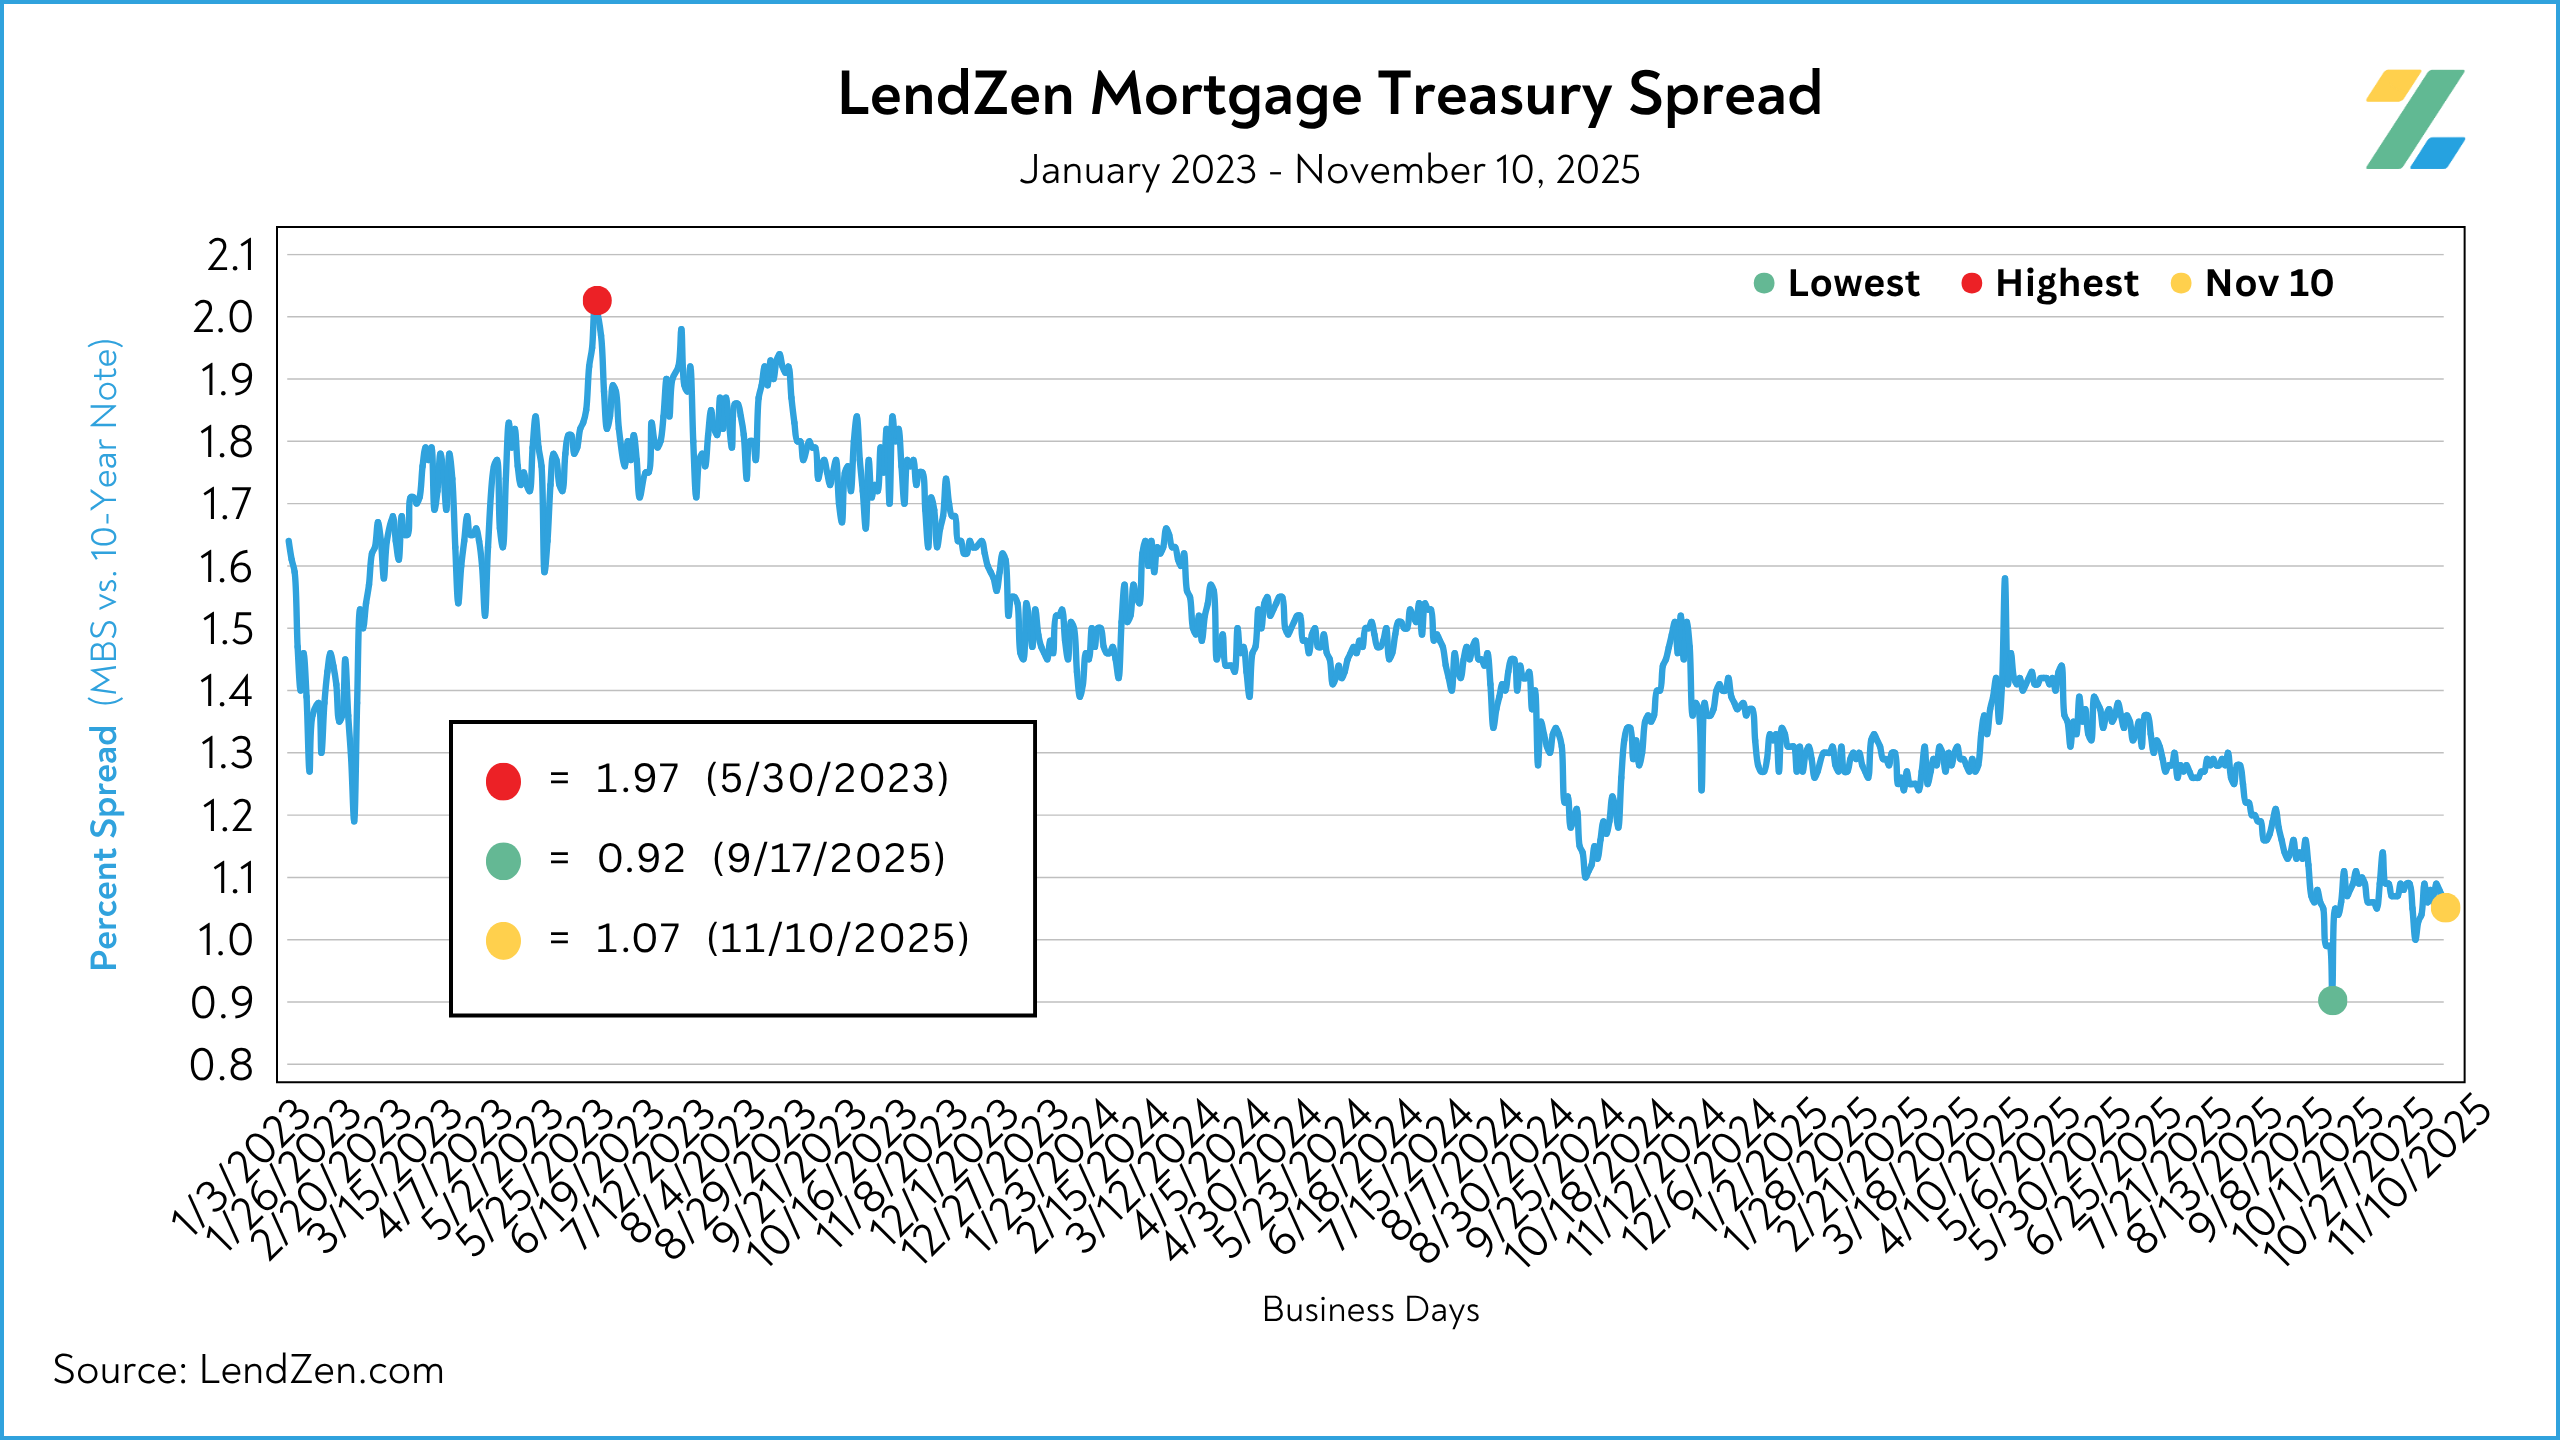
The spread between mortgage bonds and the U.S. 10-Year widened 4-bps during the week, after flirting with a sub-1% spread before the Fed rate cut decision.
Nov 03 = 1.06
Nov 07 = 1.08
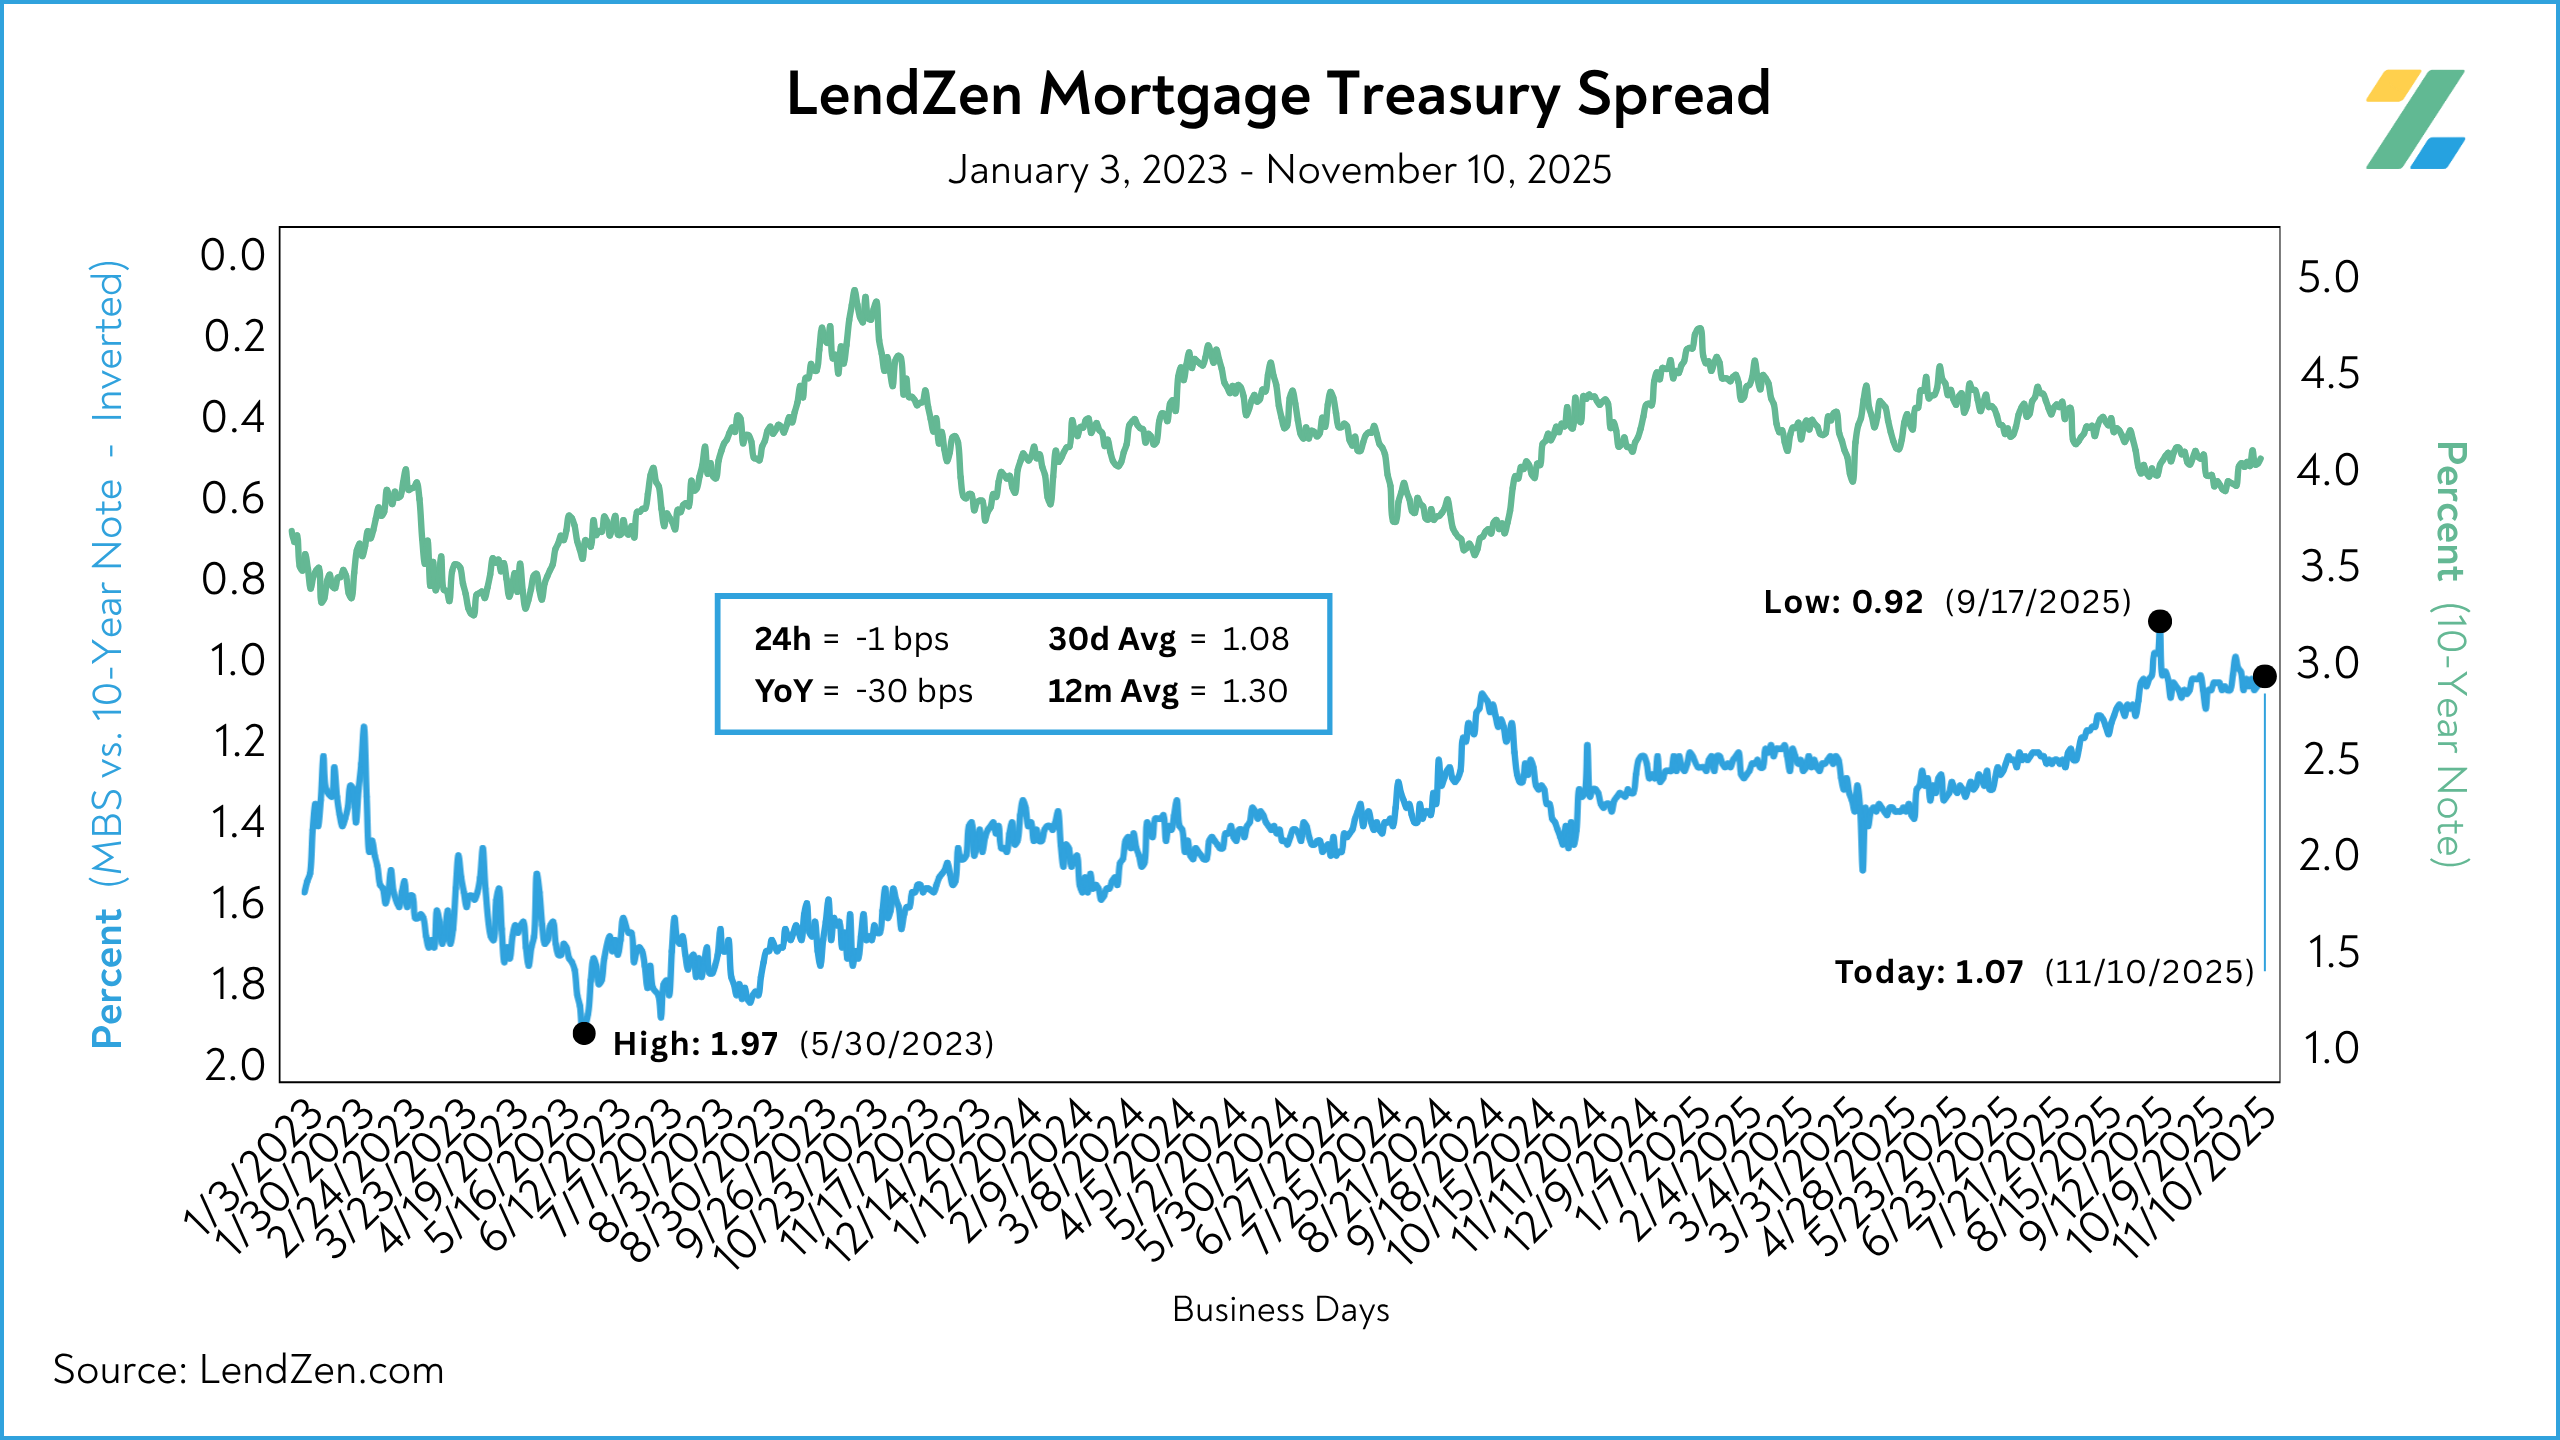
30d Avg = 1.08
12m Avg = 1.30
YoY = - 30 bps (1.38)
However, with a decline of over 30 bps since last year, spreads have been the real story behind mortgage rates now versus 2024.
Get the full scoop in this recent Substack post.
RATE LOCK GUIDE 🔒
---------------------
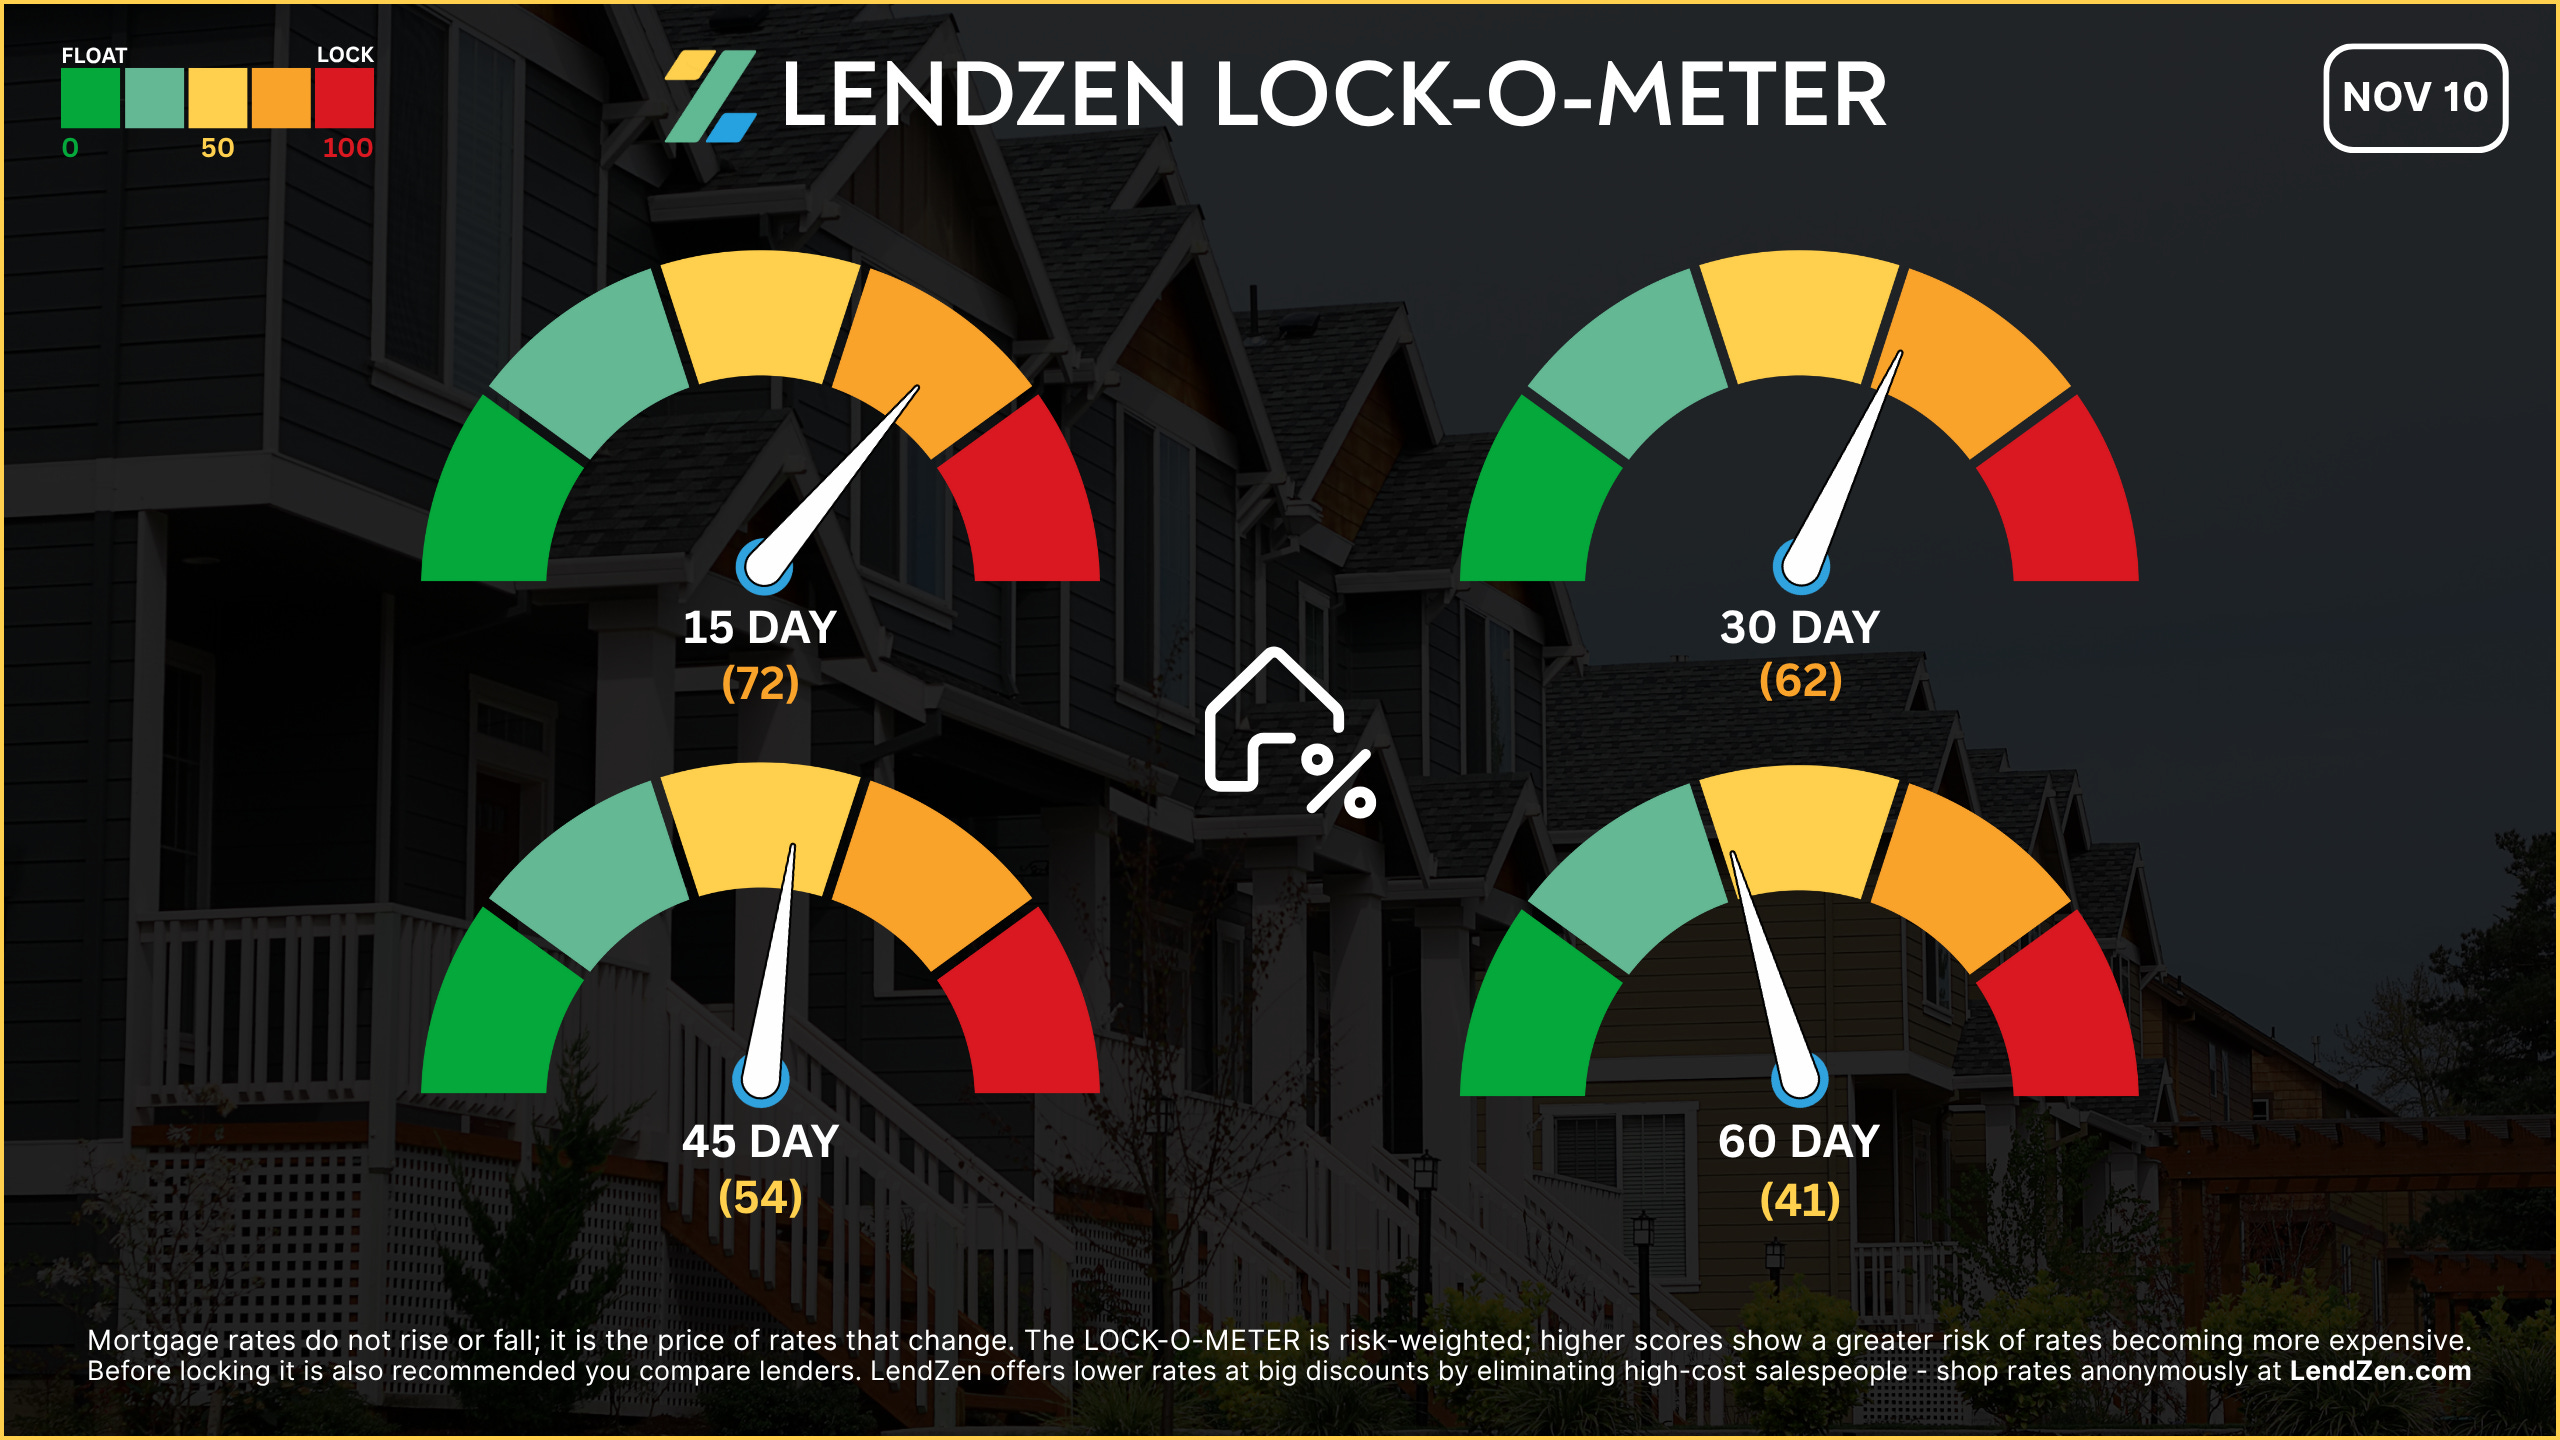
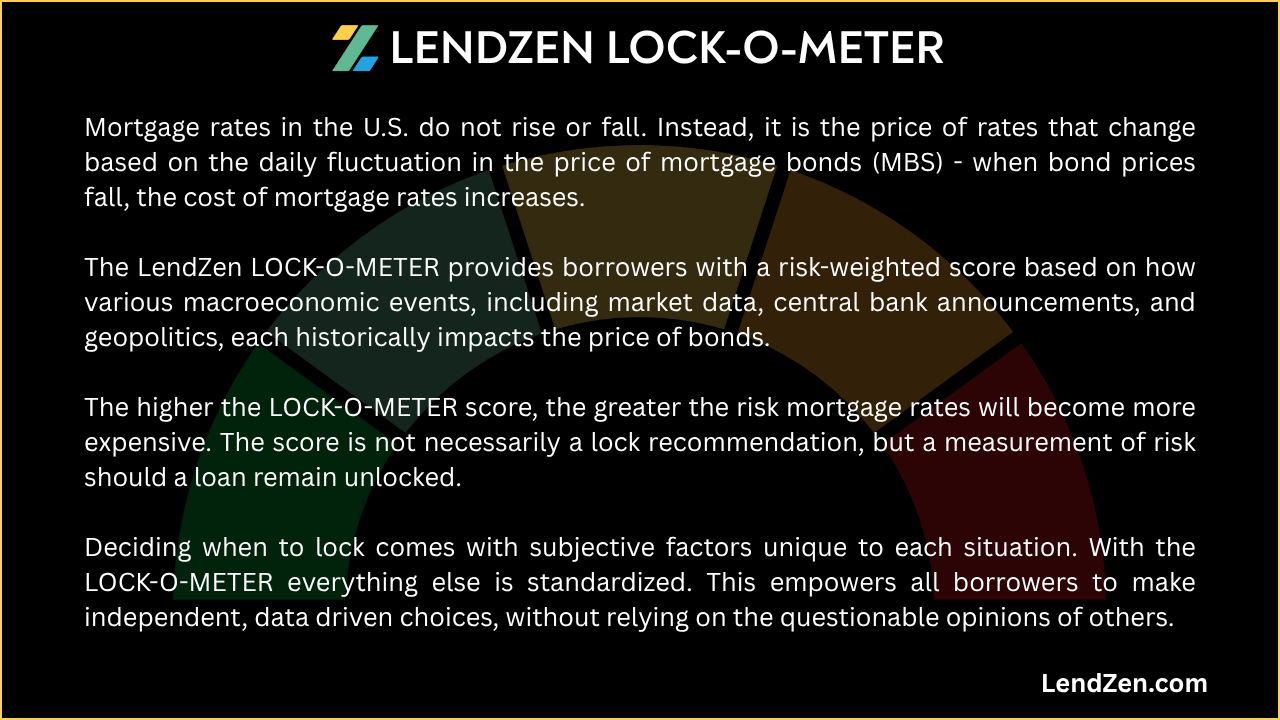
The LendZen LOCK-O-METER provides borrowers with a risk-weighted score based on how various macroeconomic events, including market data, central bank announcements, and geopolitics, each historically impacts the price of bonds.
higher risk scores = lean towards locking
------------------
Closing Window
------------------
[ 15 Days ] -- 72 🟠
Despite Friday’s consumer sentiment helping bonds recover, the lack of “scheduled” high-impact data keeps risks elevated, as markets will be responding to outlier news and data.
[ 30 Days ] -- 62 🟠
Equilibrium has returned post-FOMC, but without decisive data, there’s little momentum to break the current range.
[ 45 Days ] -- 54 🟡
Markets are cautiously optimistic the government shutdown may end. When this happens we should finally clarity on inflation trends and labor strength. Until then remain vigilant and look for a clear breakout in either direction.
[ 60 Days ] -- 41 🟡
Disinflation expectations appear intact, and is what longer-term timelines should lean on until the shutdown delayed data is back on schedule.
If you are already in a strong position, locking makes the most sense since the focus should be on making a savvy rate choice based on your longer-term rate outlook.
I expand on this “long game” approach in this Substack article.
Thanks for reading.
If you are interested in more mortgage insights, then I suggest checking out this recent Substack article.
