
Mortgage Rate Data Deluge 🏠📉🔒 (DEC 1)
Here is a deluge of mortgage rate data to start your week!

Included in this week’s deluge are the following sections:
MARKET RECAP ⏪
--------------------
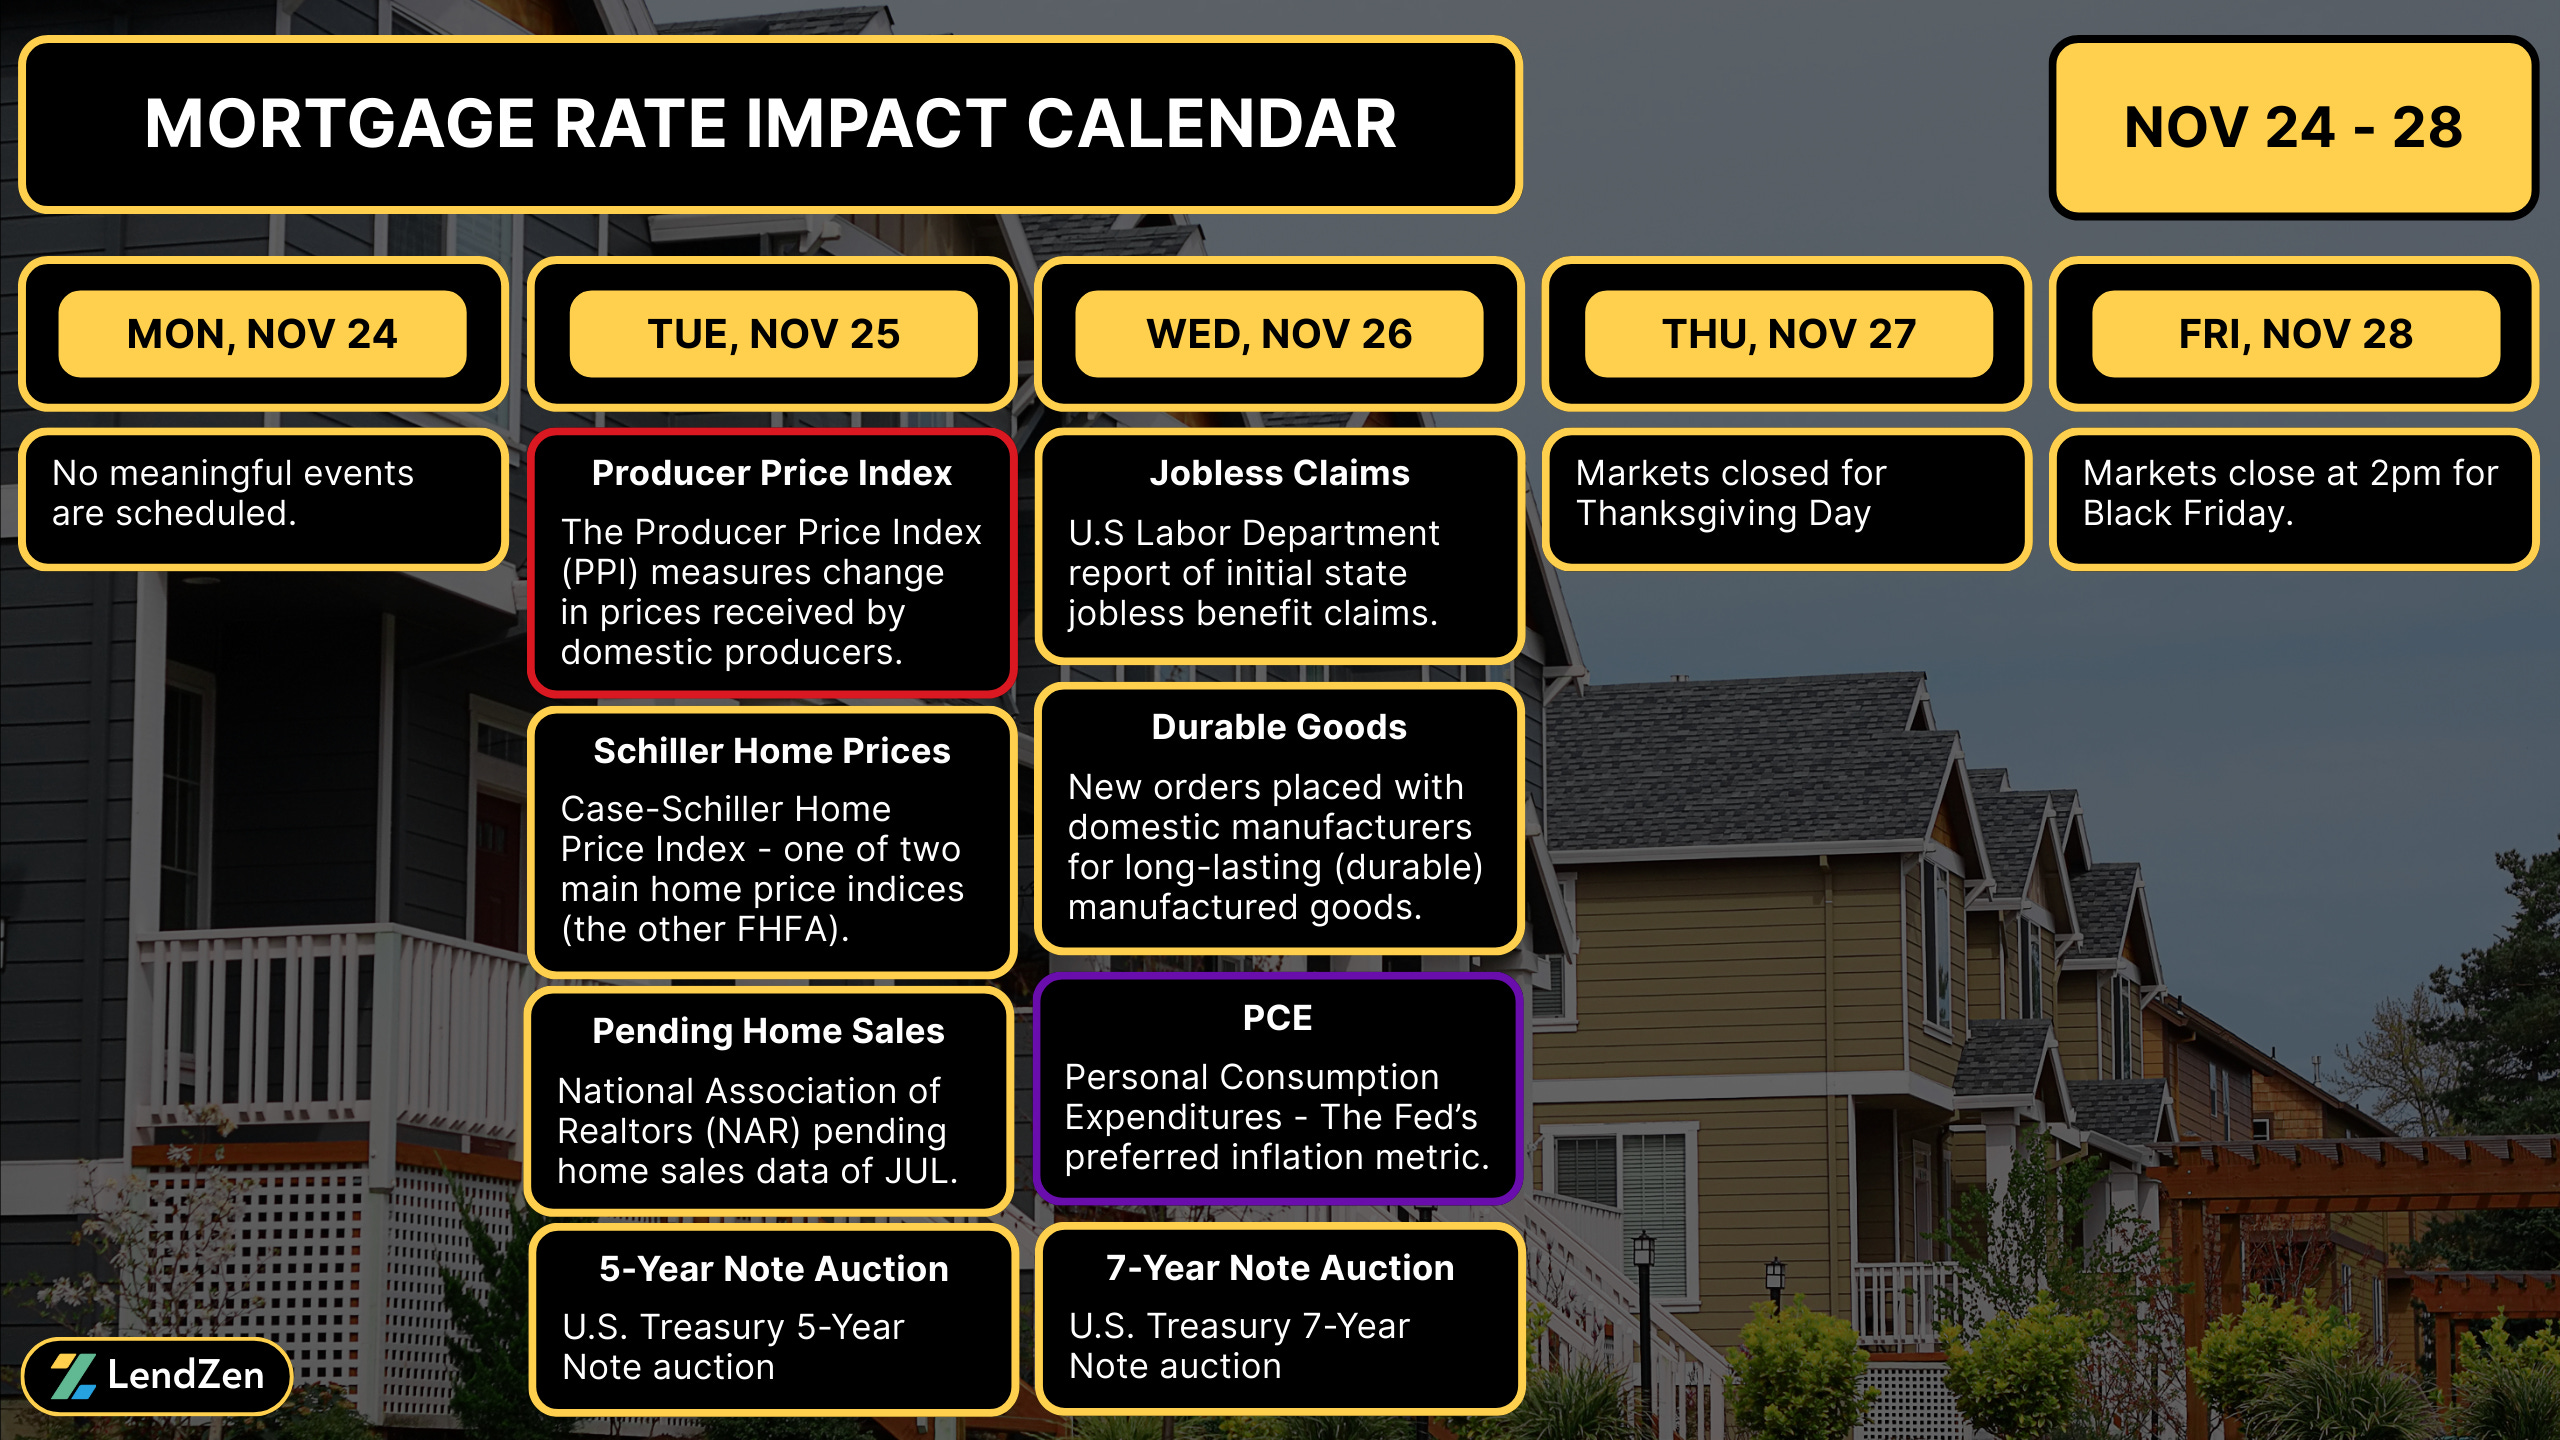
Quiet trading defined the short Thanksgiving week, with bonds getting a mild boost from the sparsely scheduled econ data.
On Tuesday the Producers Price Index (PPI), retail sales, and weekly ADP payrolls all helped mortgage rates.
BEARISH BITCOIN 🐻
----------------------
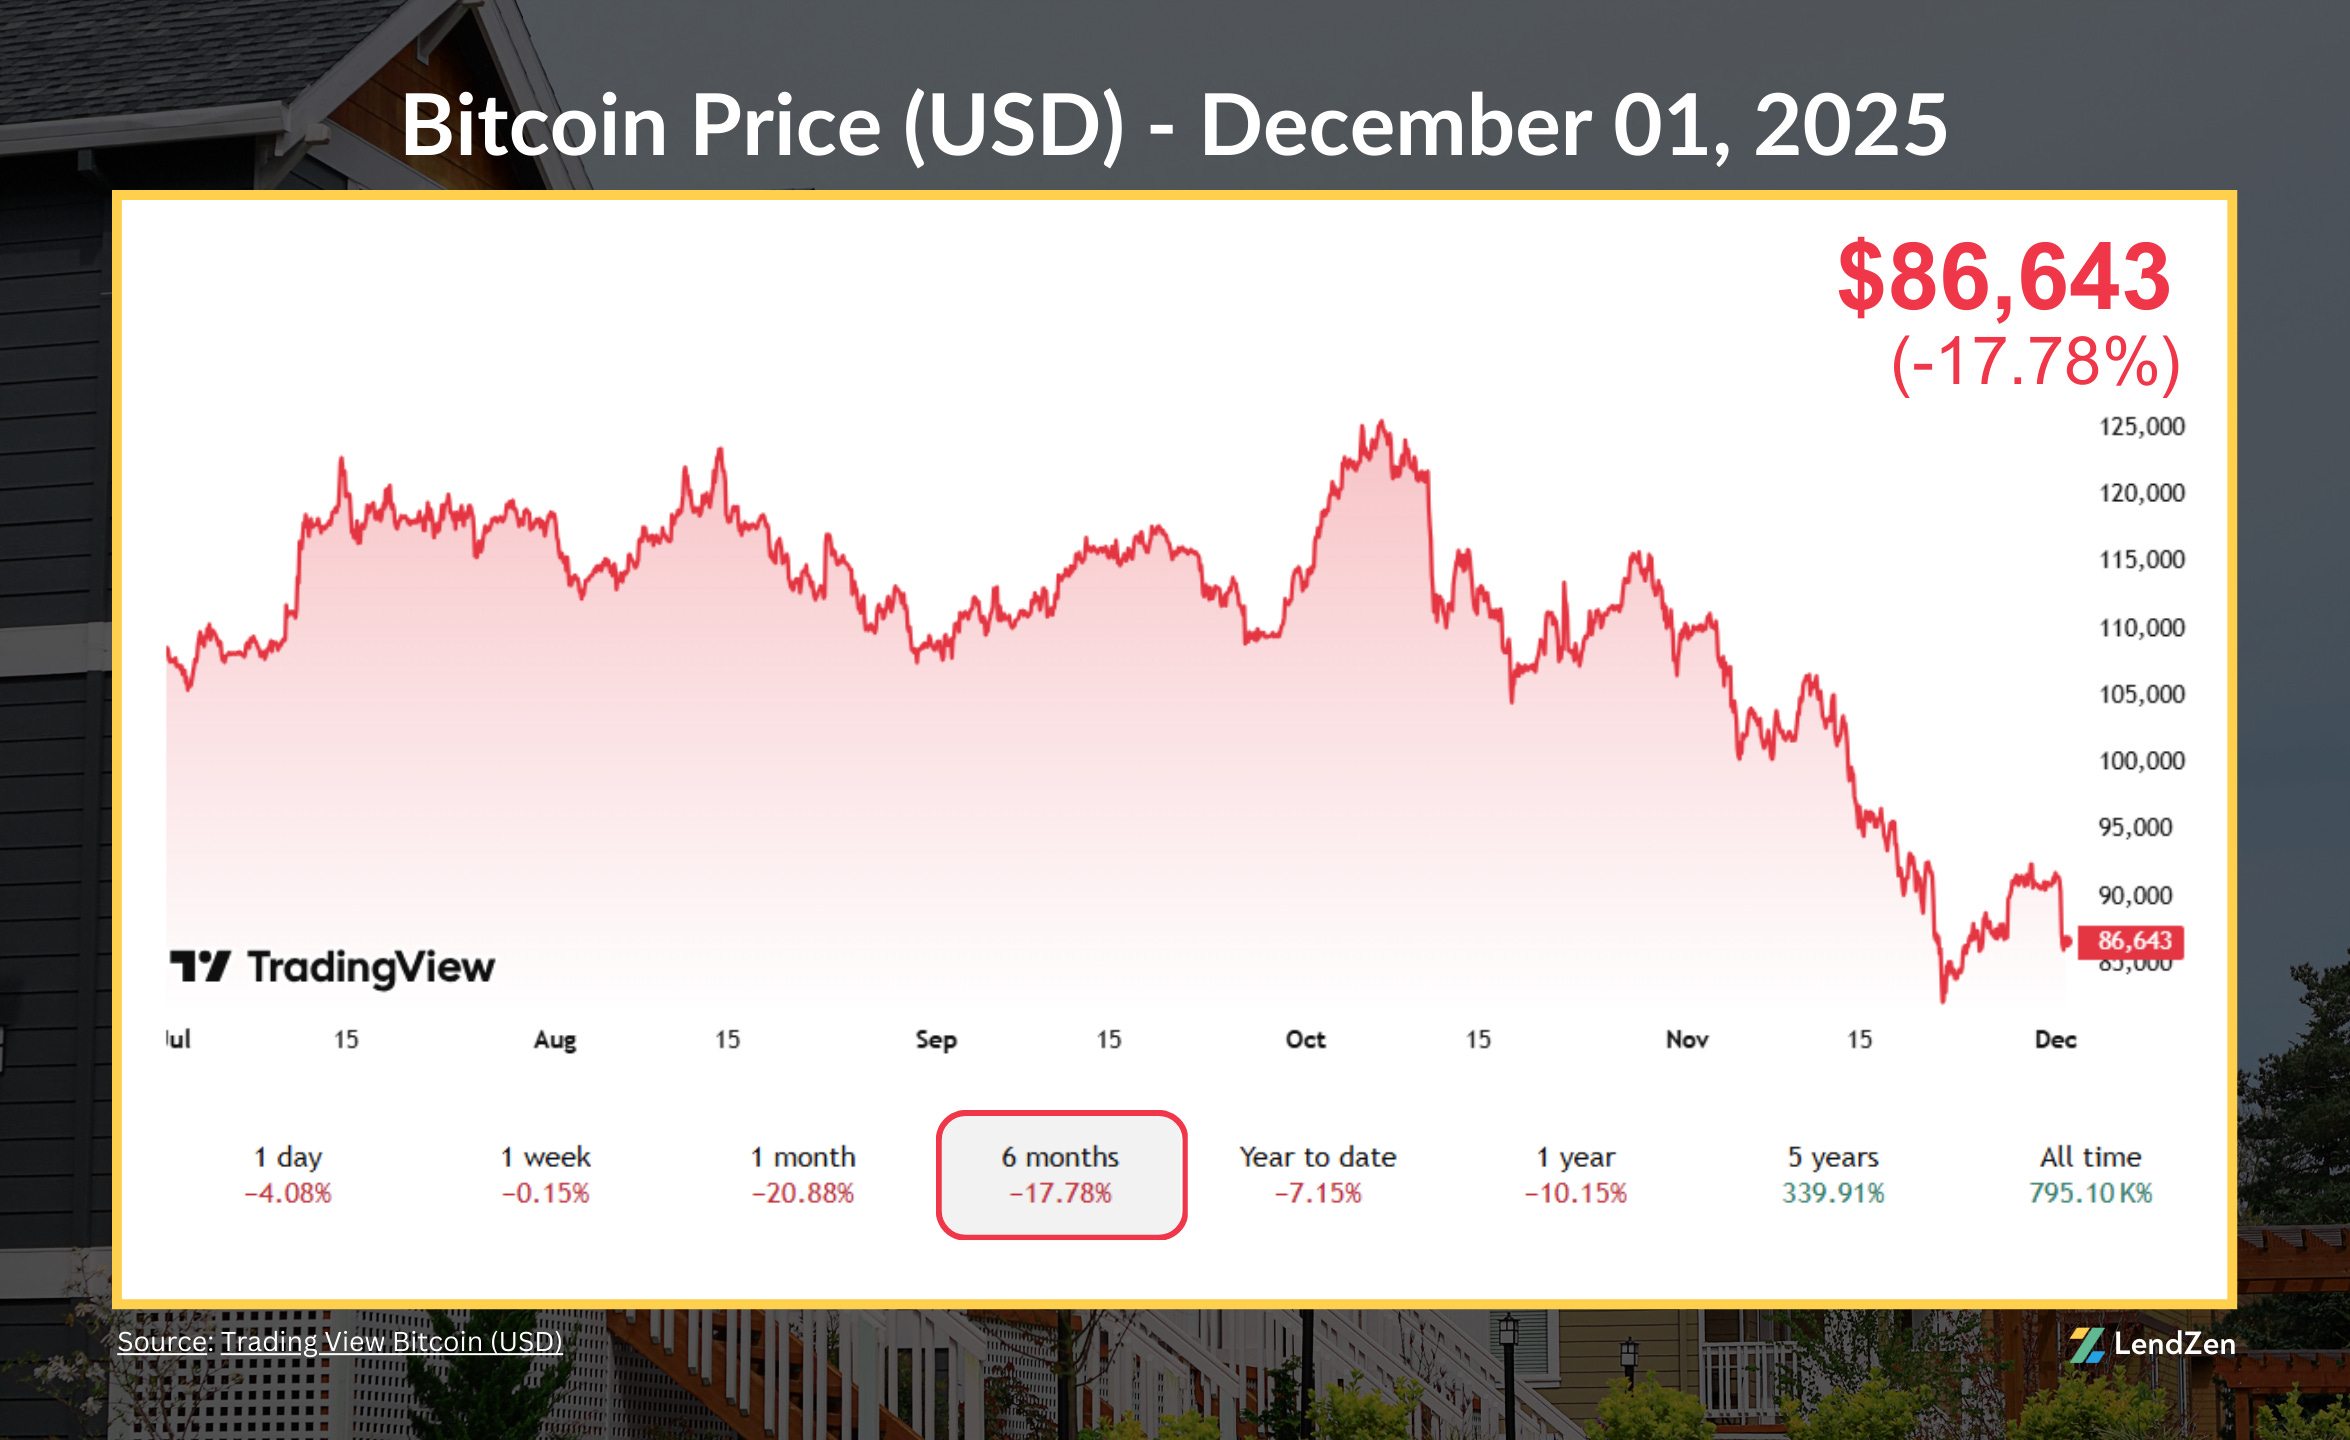
The beatdown on Bitcoin took a breather last week but looks ready to resume the bear market bloodbath.
After sliding over 30% from the all-time highs to $85K, Bitcoin climbed 8% to get back above $91K.
However, it’s down 4% in the last 24 hours, retesting $85K.
The previous all-time high of $71K is a significant support level that could lead to a total meltdown if broken.
Crypto markets have become a barometer for investor risk appetite and market liquidity.
Big moves down like this matter to mortgage rates because they could be an early sign that sentiment is shifting more towards “risk off”, which favors higher bond prices.
TOP CITIES (SINCE 2019) 🏢
------------------------------
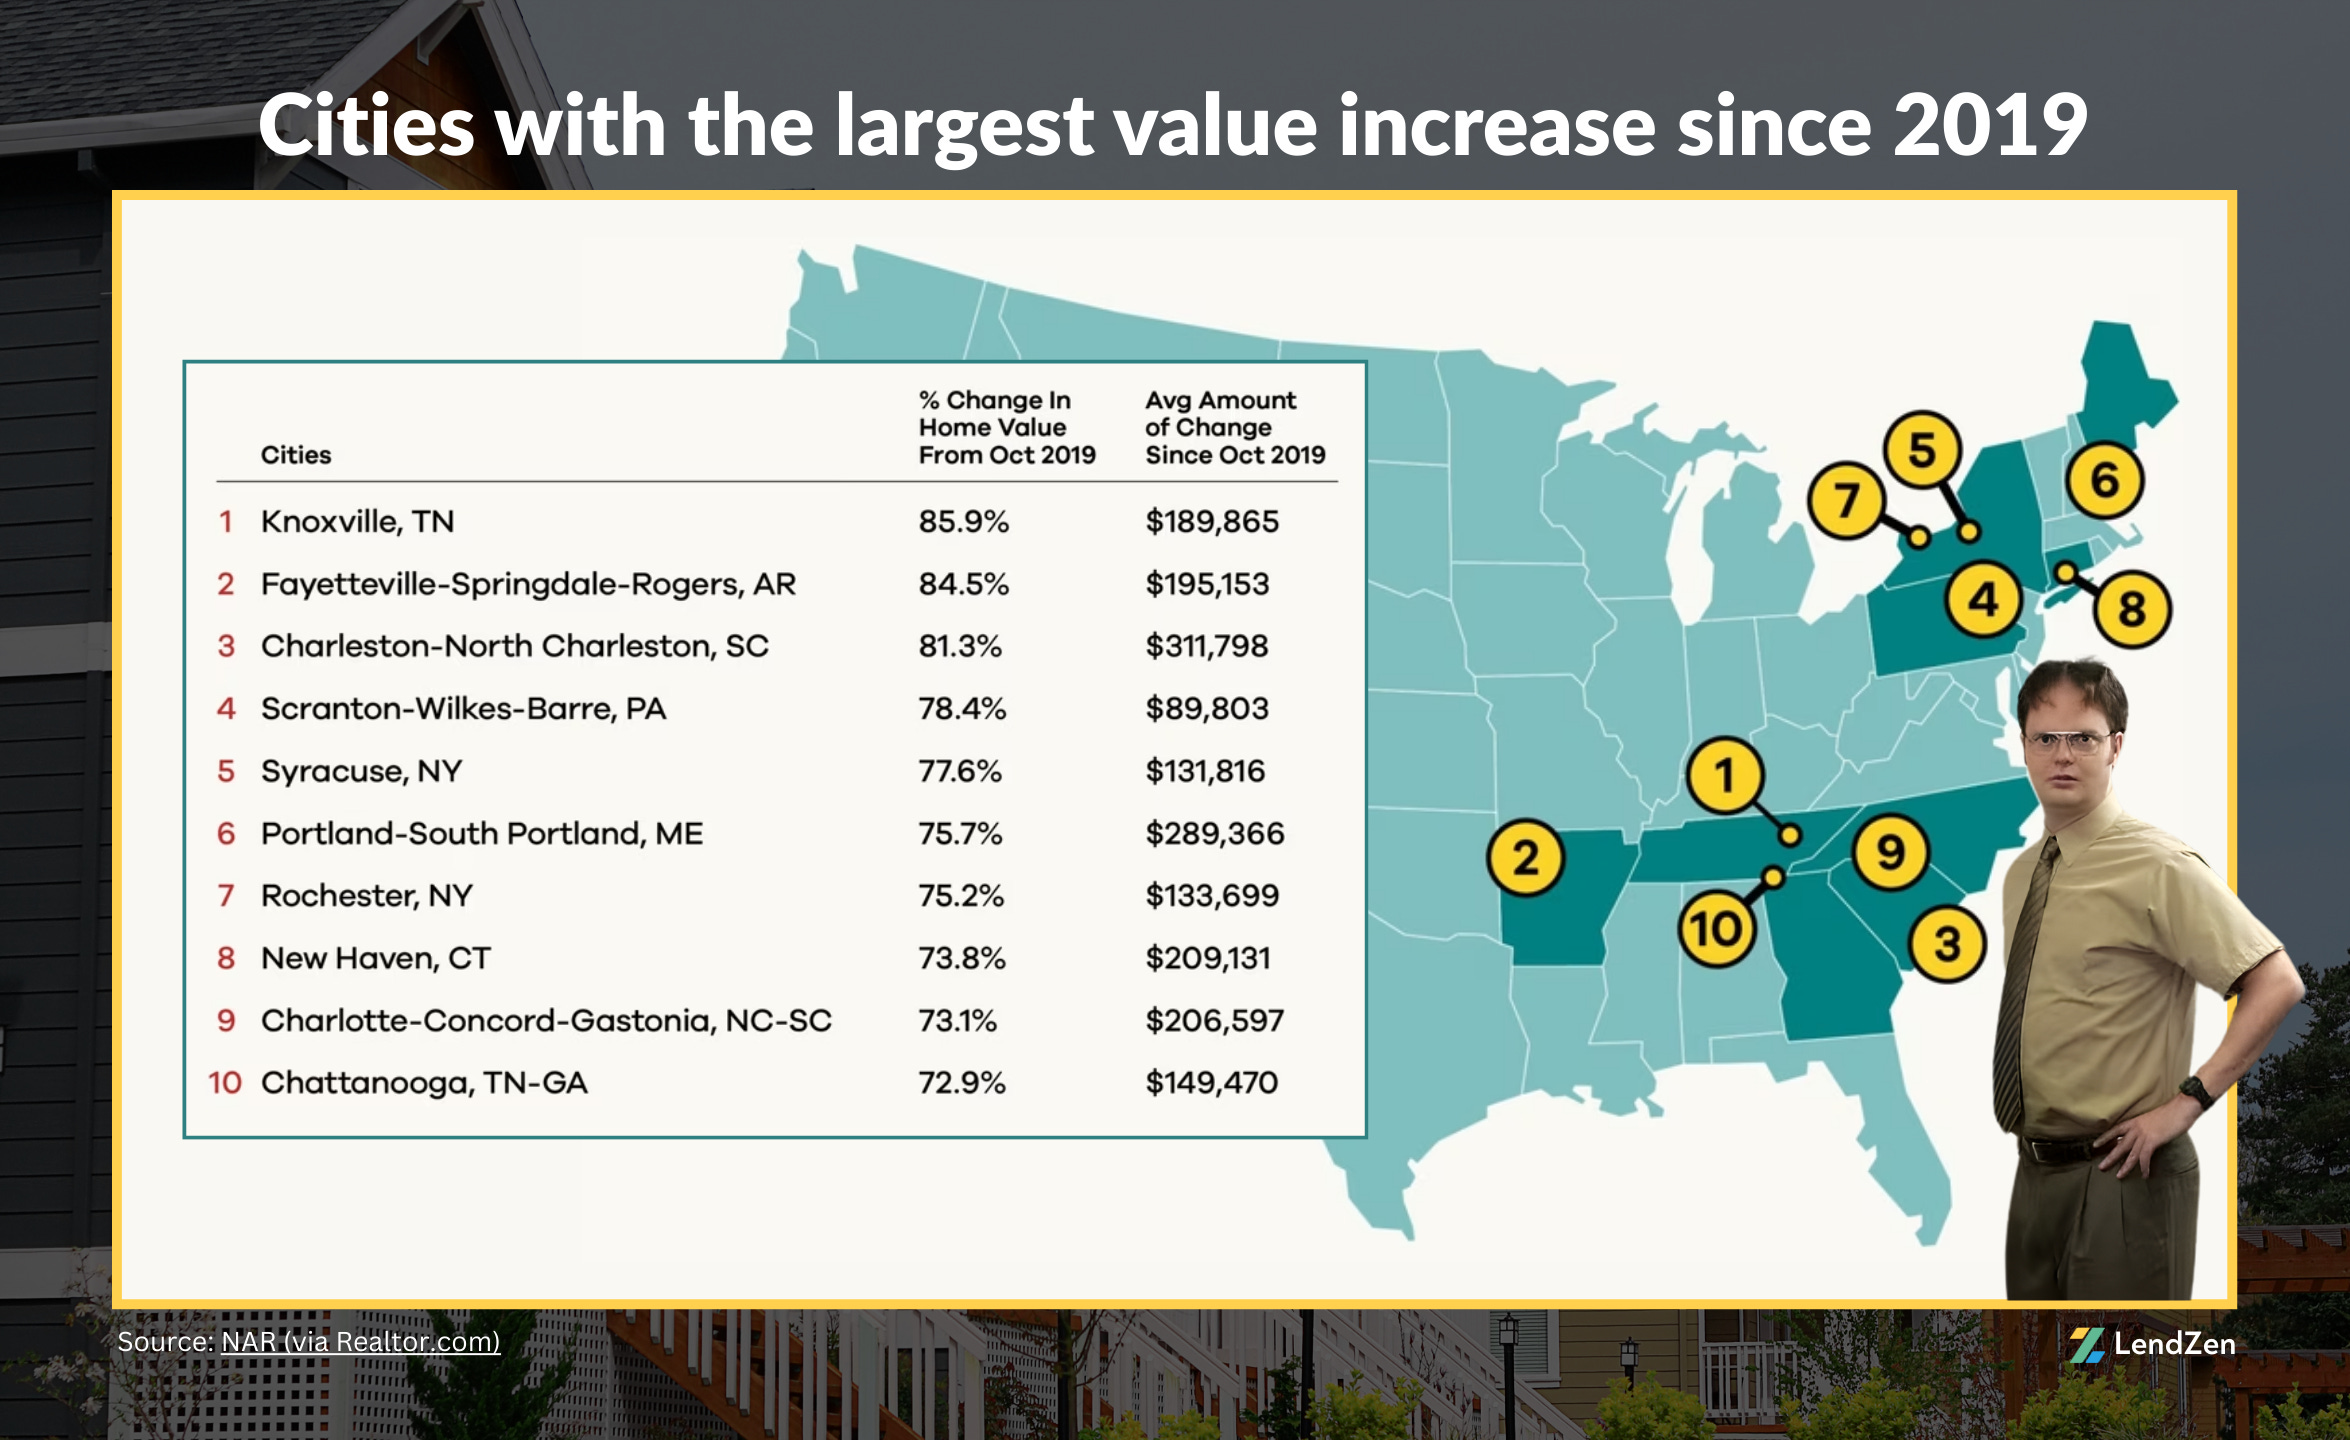
Here are the cities with the largest value increase since 2019.
Coming in 4th is Scranton, PA.
“Buttlicker! Our prices have never been higher!”
MORTGAGE RATE PRICES 📉
-------------------------------
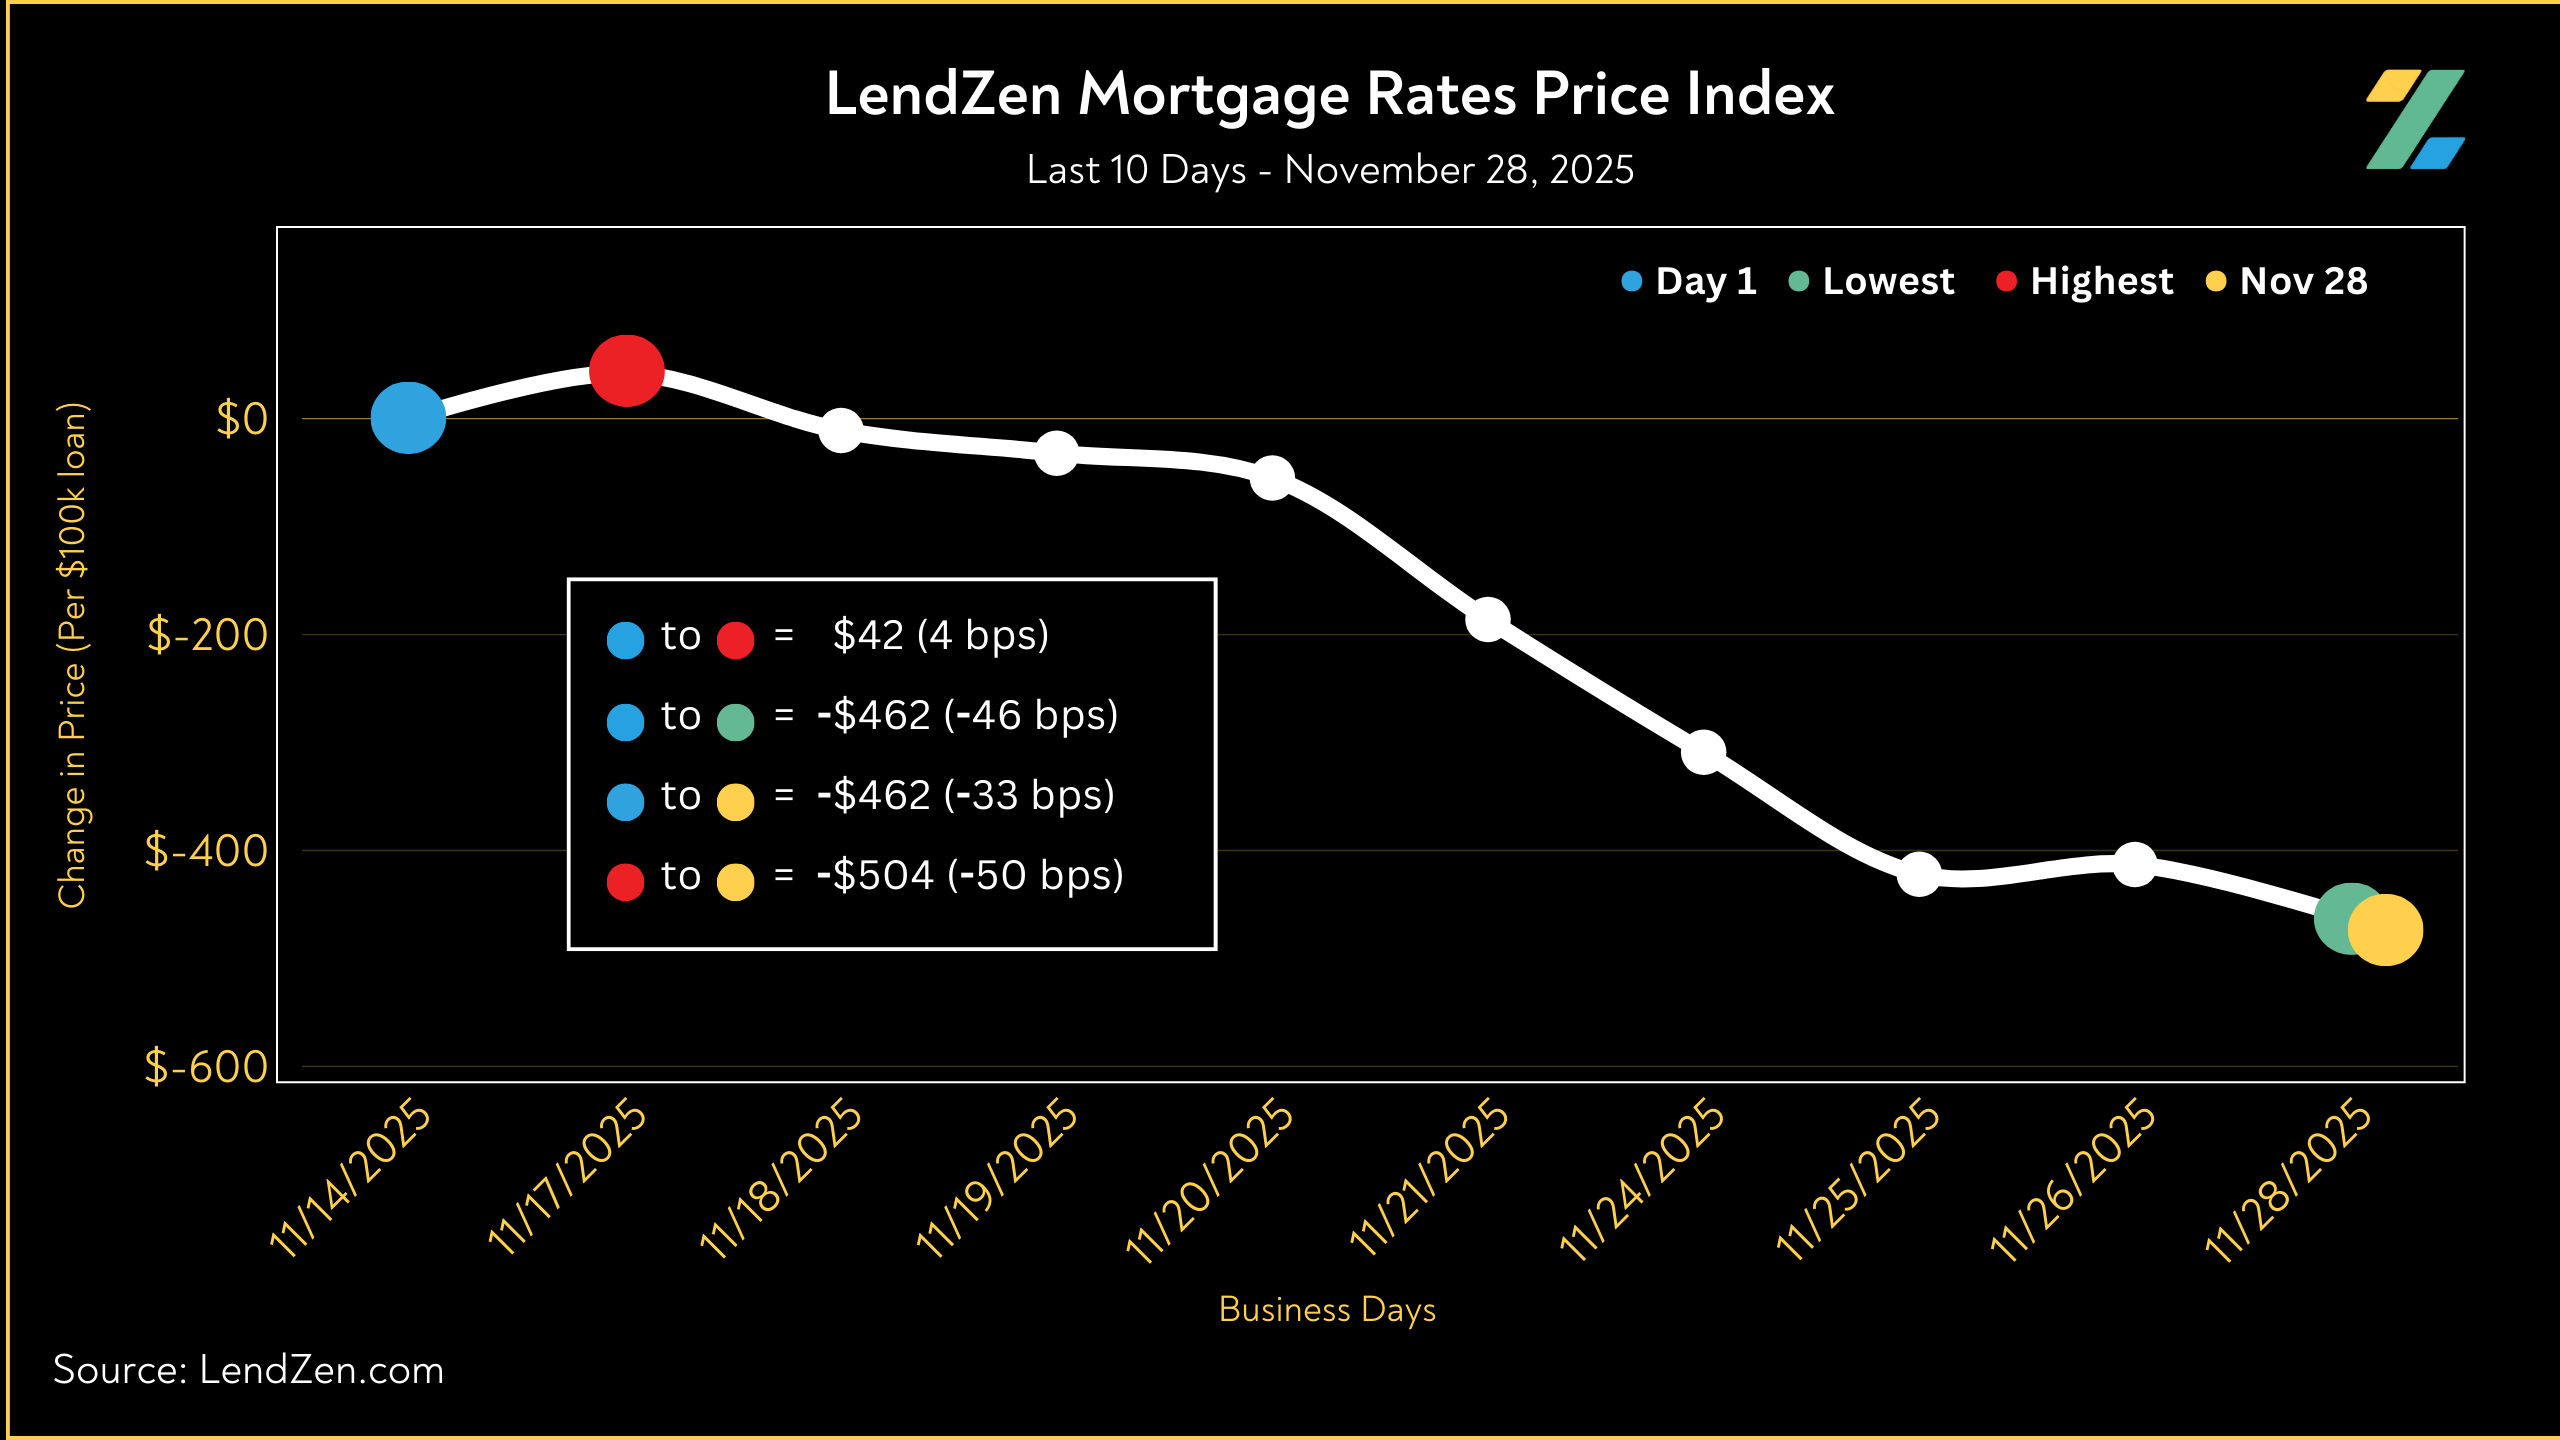
Mortgage rates do not rise or fall, instead the PRICE of rates change.
The LendZen Index calculates a daily change in the price of mortgage rates by tracking a spectrum of mortgage-backed securities (MBS).
This provides borrowers with a more specific measurement of how the cost to obtain a mortgage is changing, regardless of the lender, rate, or credit score.
-----------
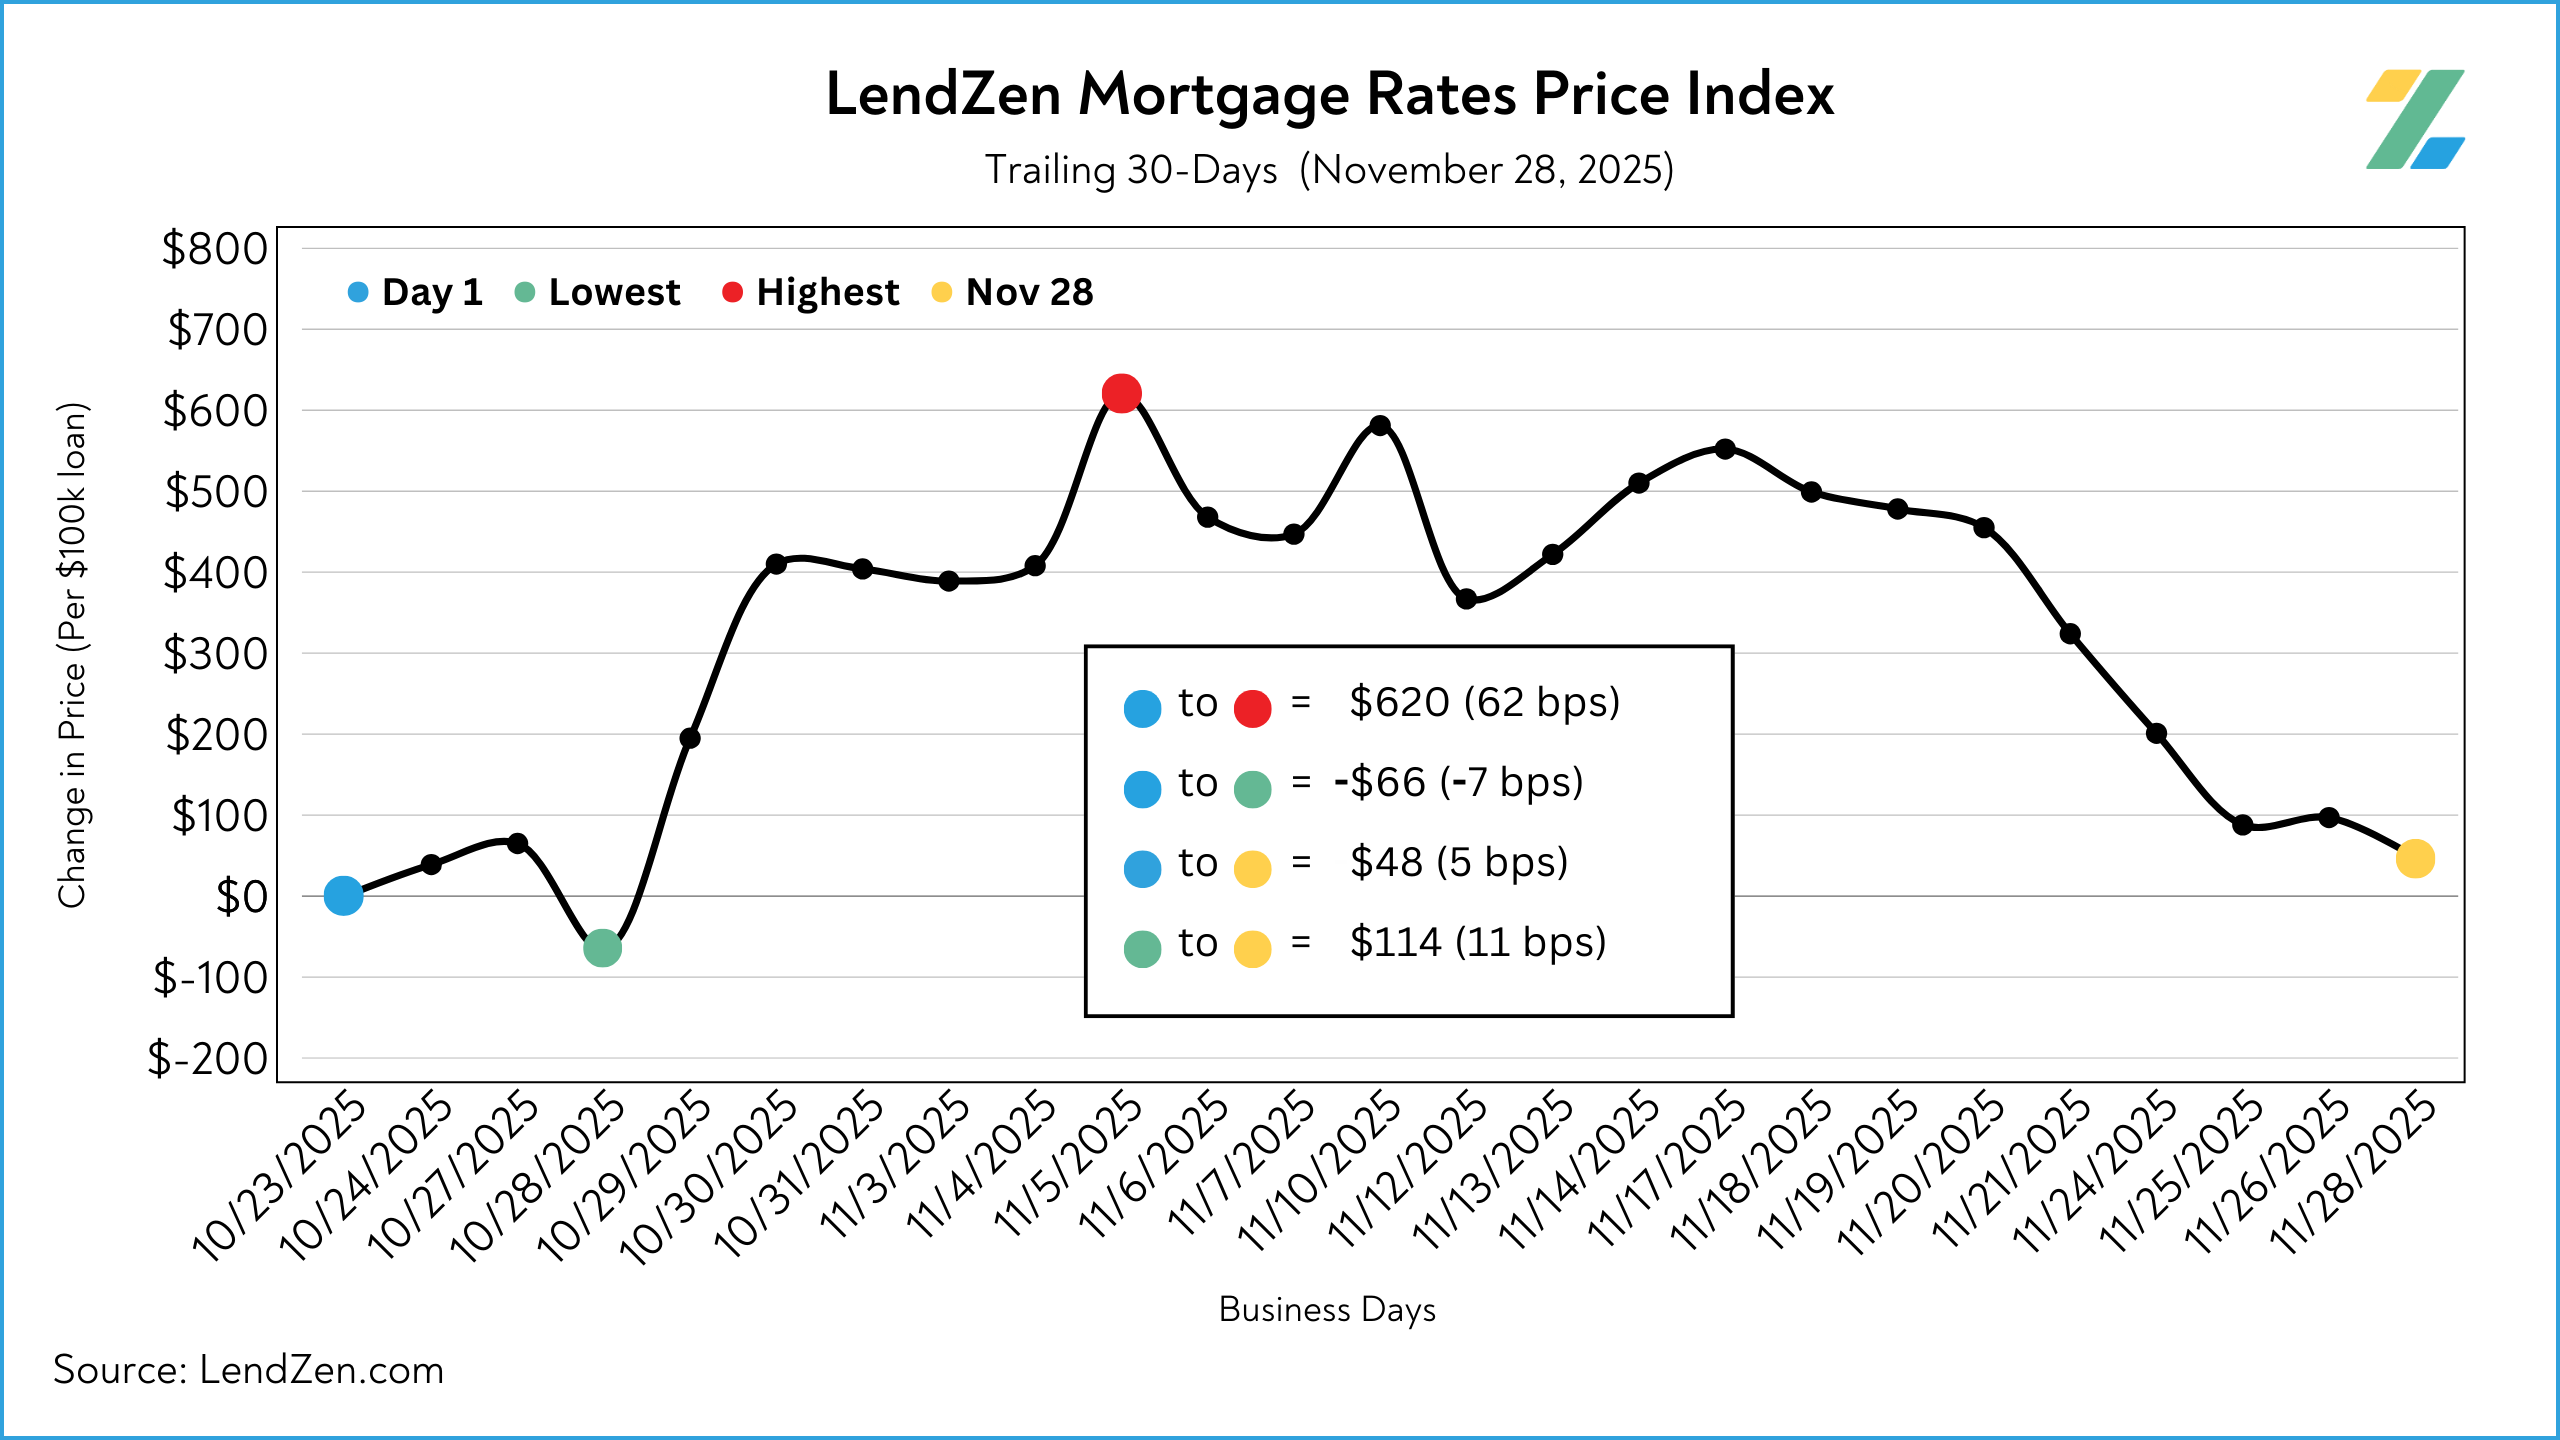
11/28/2025
-----------
24-Hour: -5 bps (-$50 per $100K)
5-Day: -28 bps (-$276)
10-Day: -46 bps (-$462)
30-Day: -15 bps (-$146)
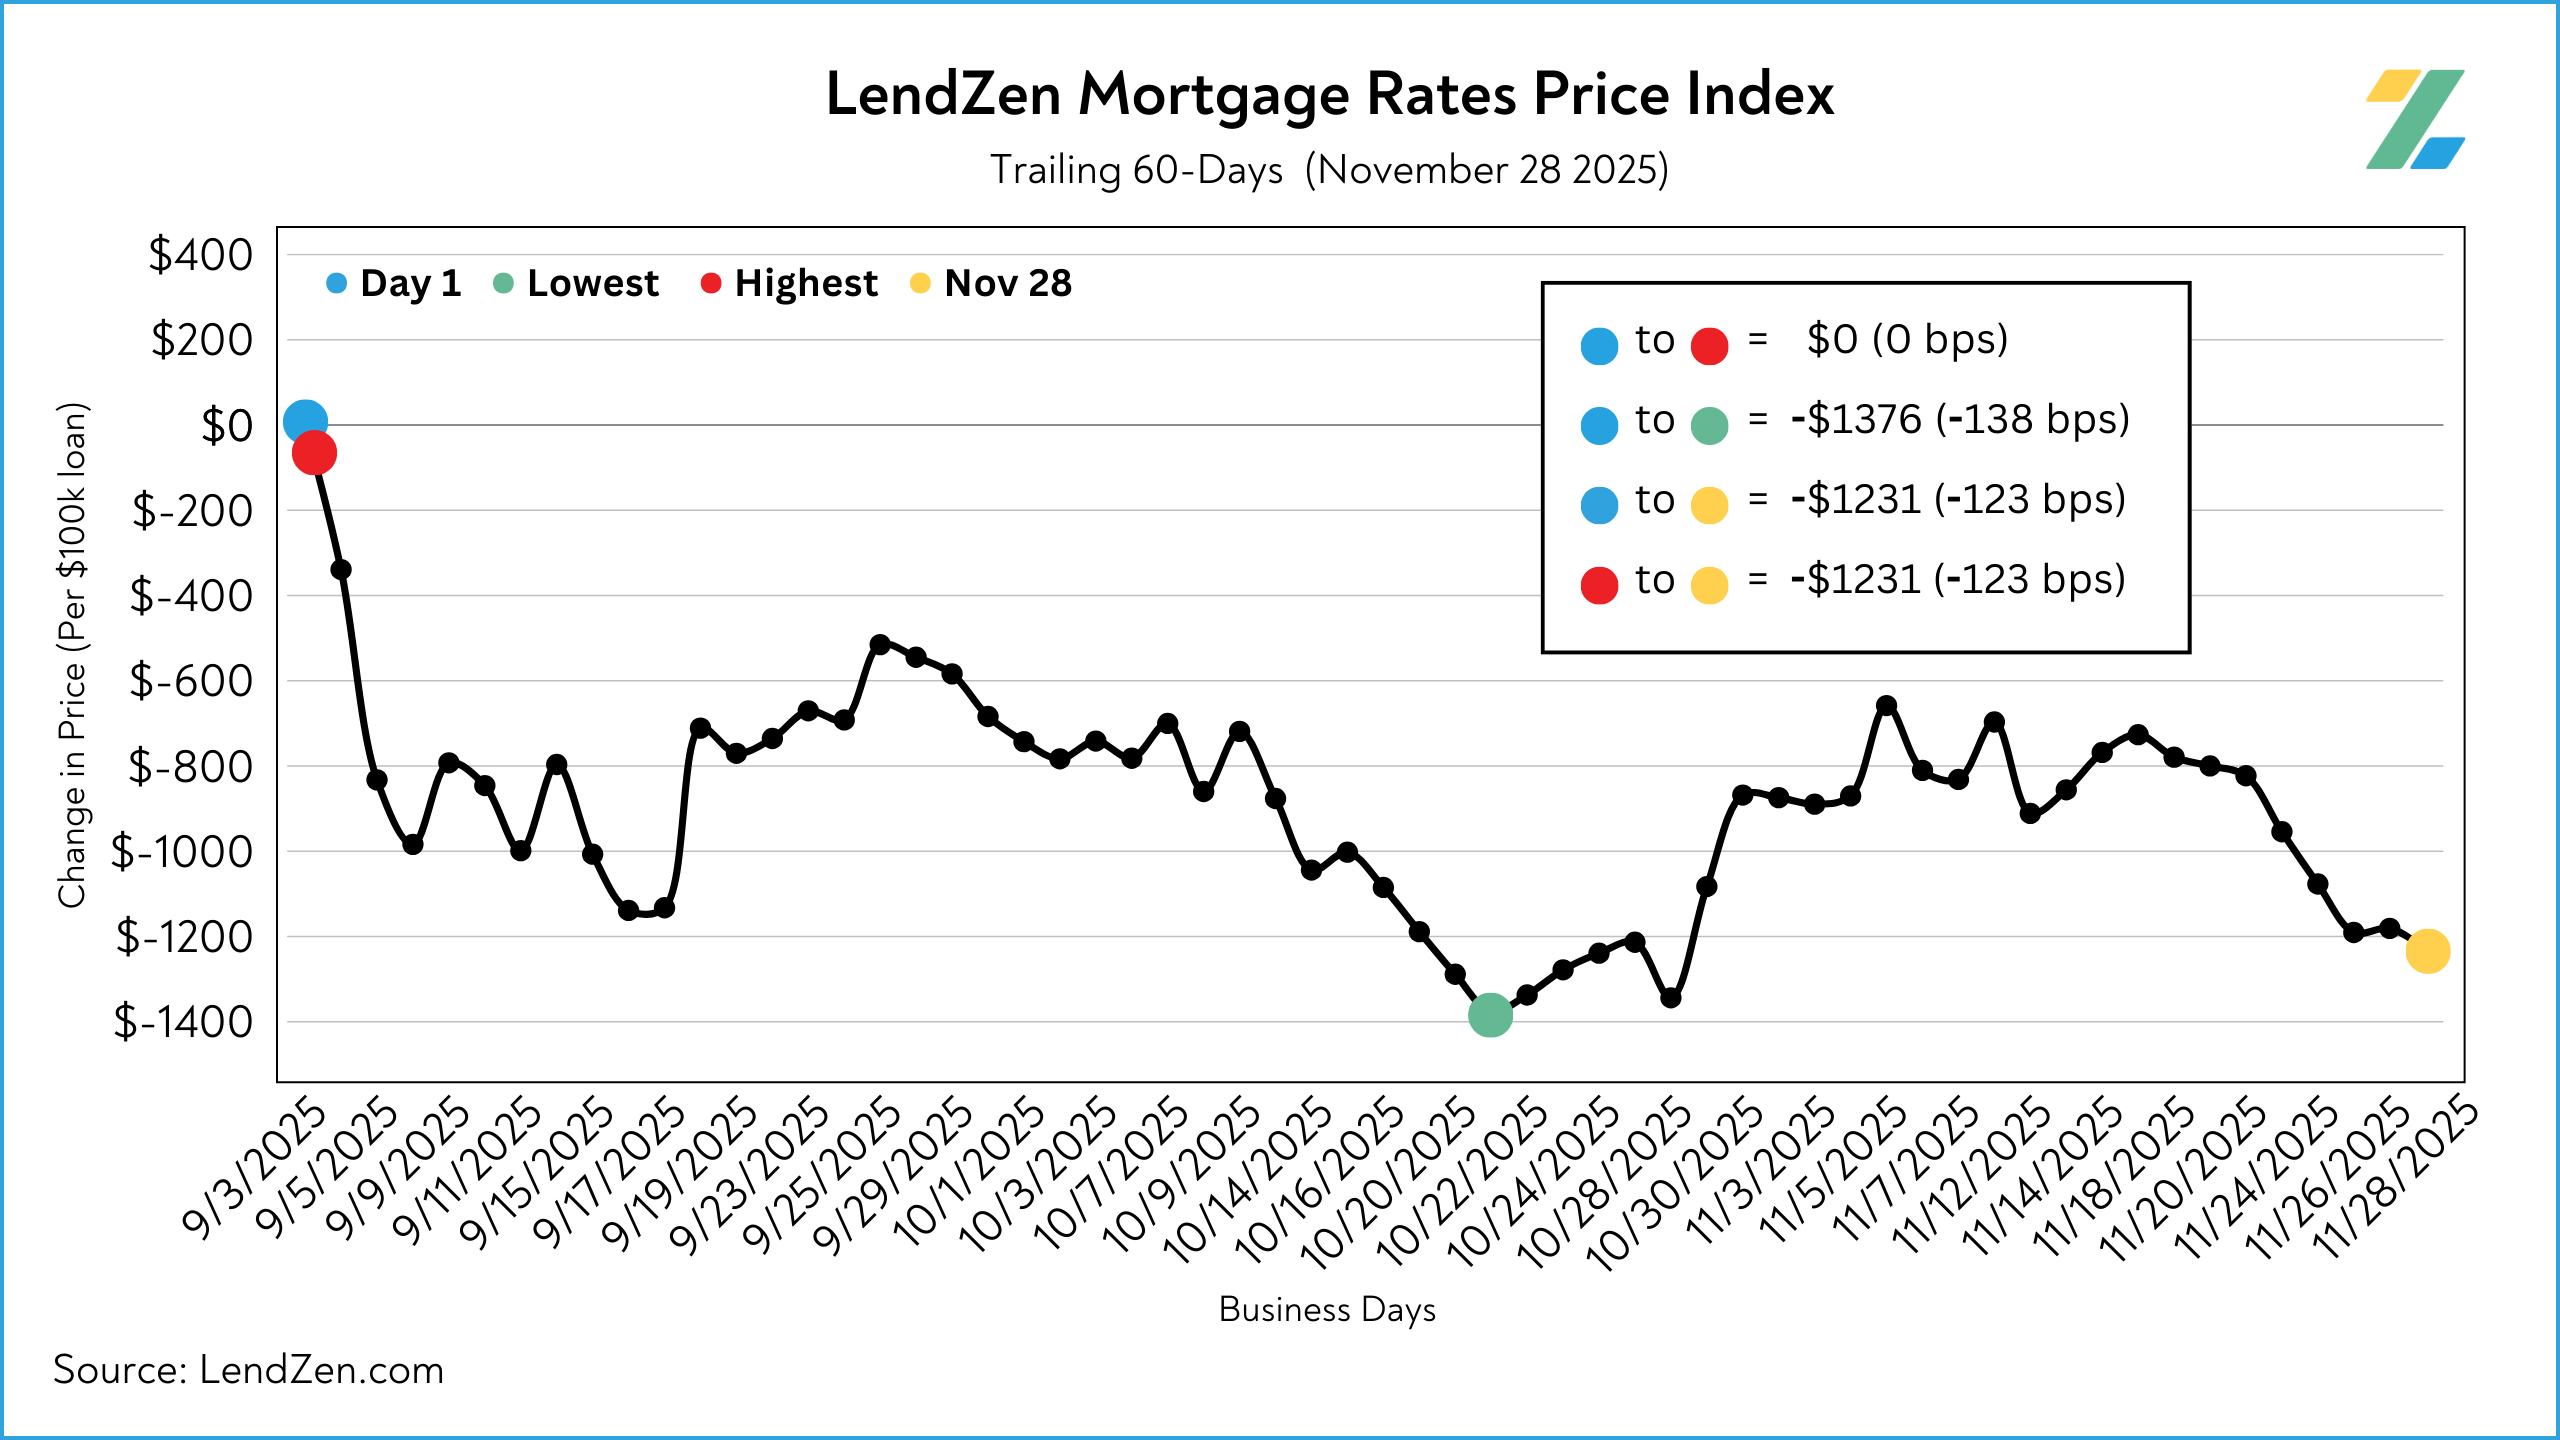
60-Day: -123 bps (-$1,231)
After rising sharply following the Fed’s October 28 rate cut, and peaking 69 basis points above the October low, mortgage rate prices remained in a sideways pattern earlier in November but slowly recovered most of the losses in the final two weeks.
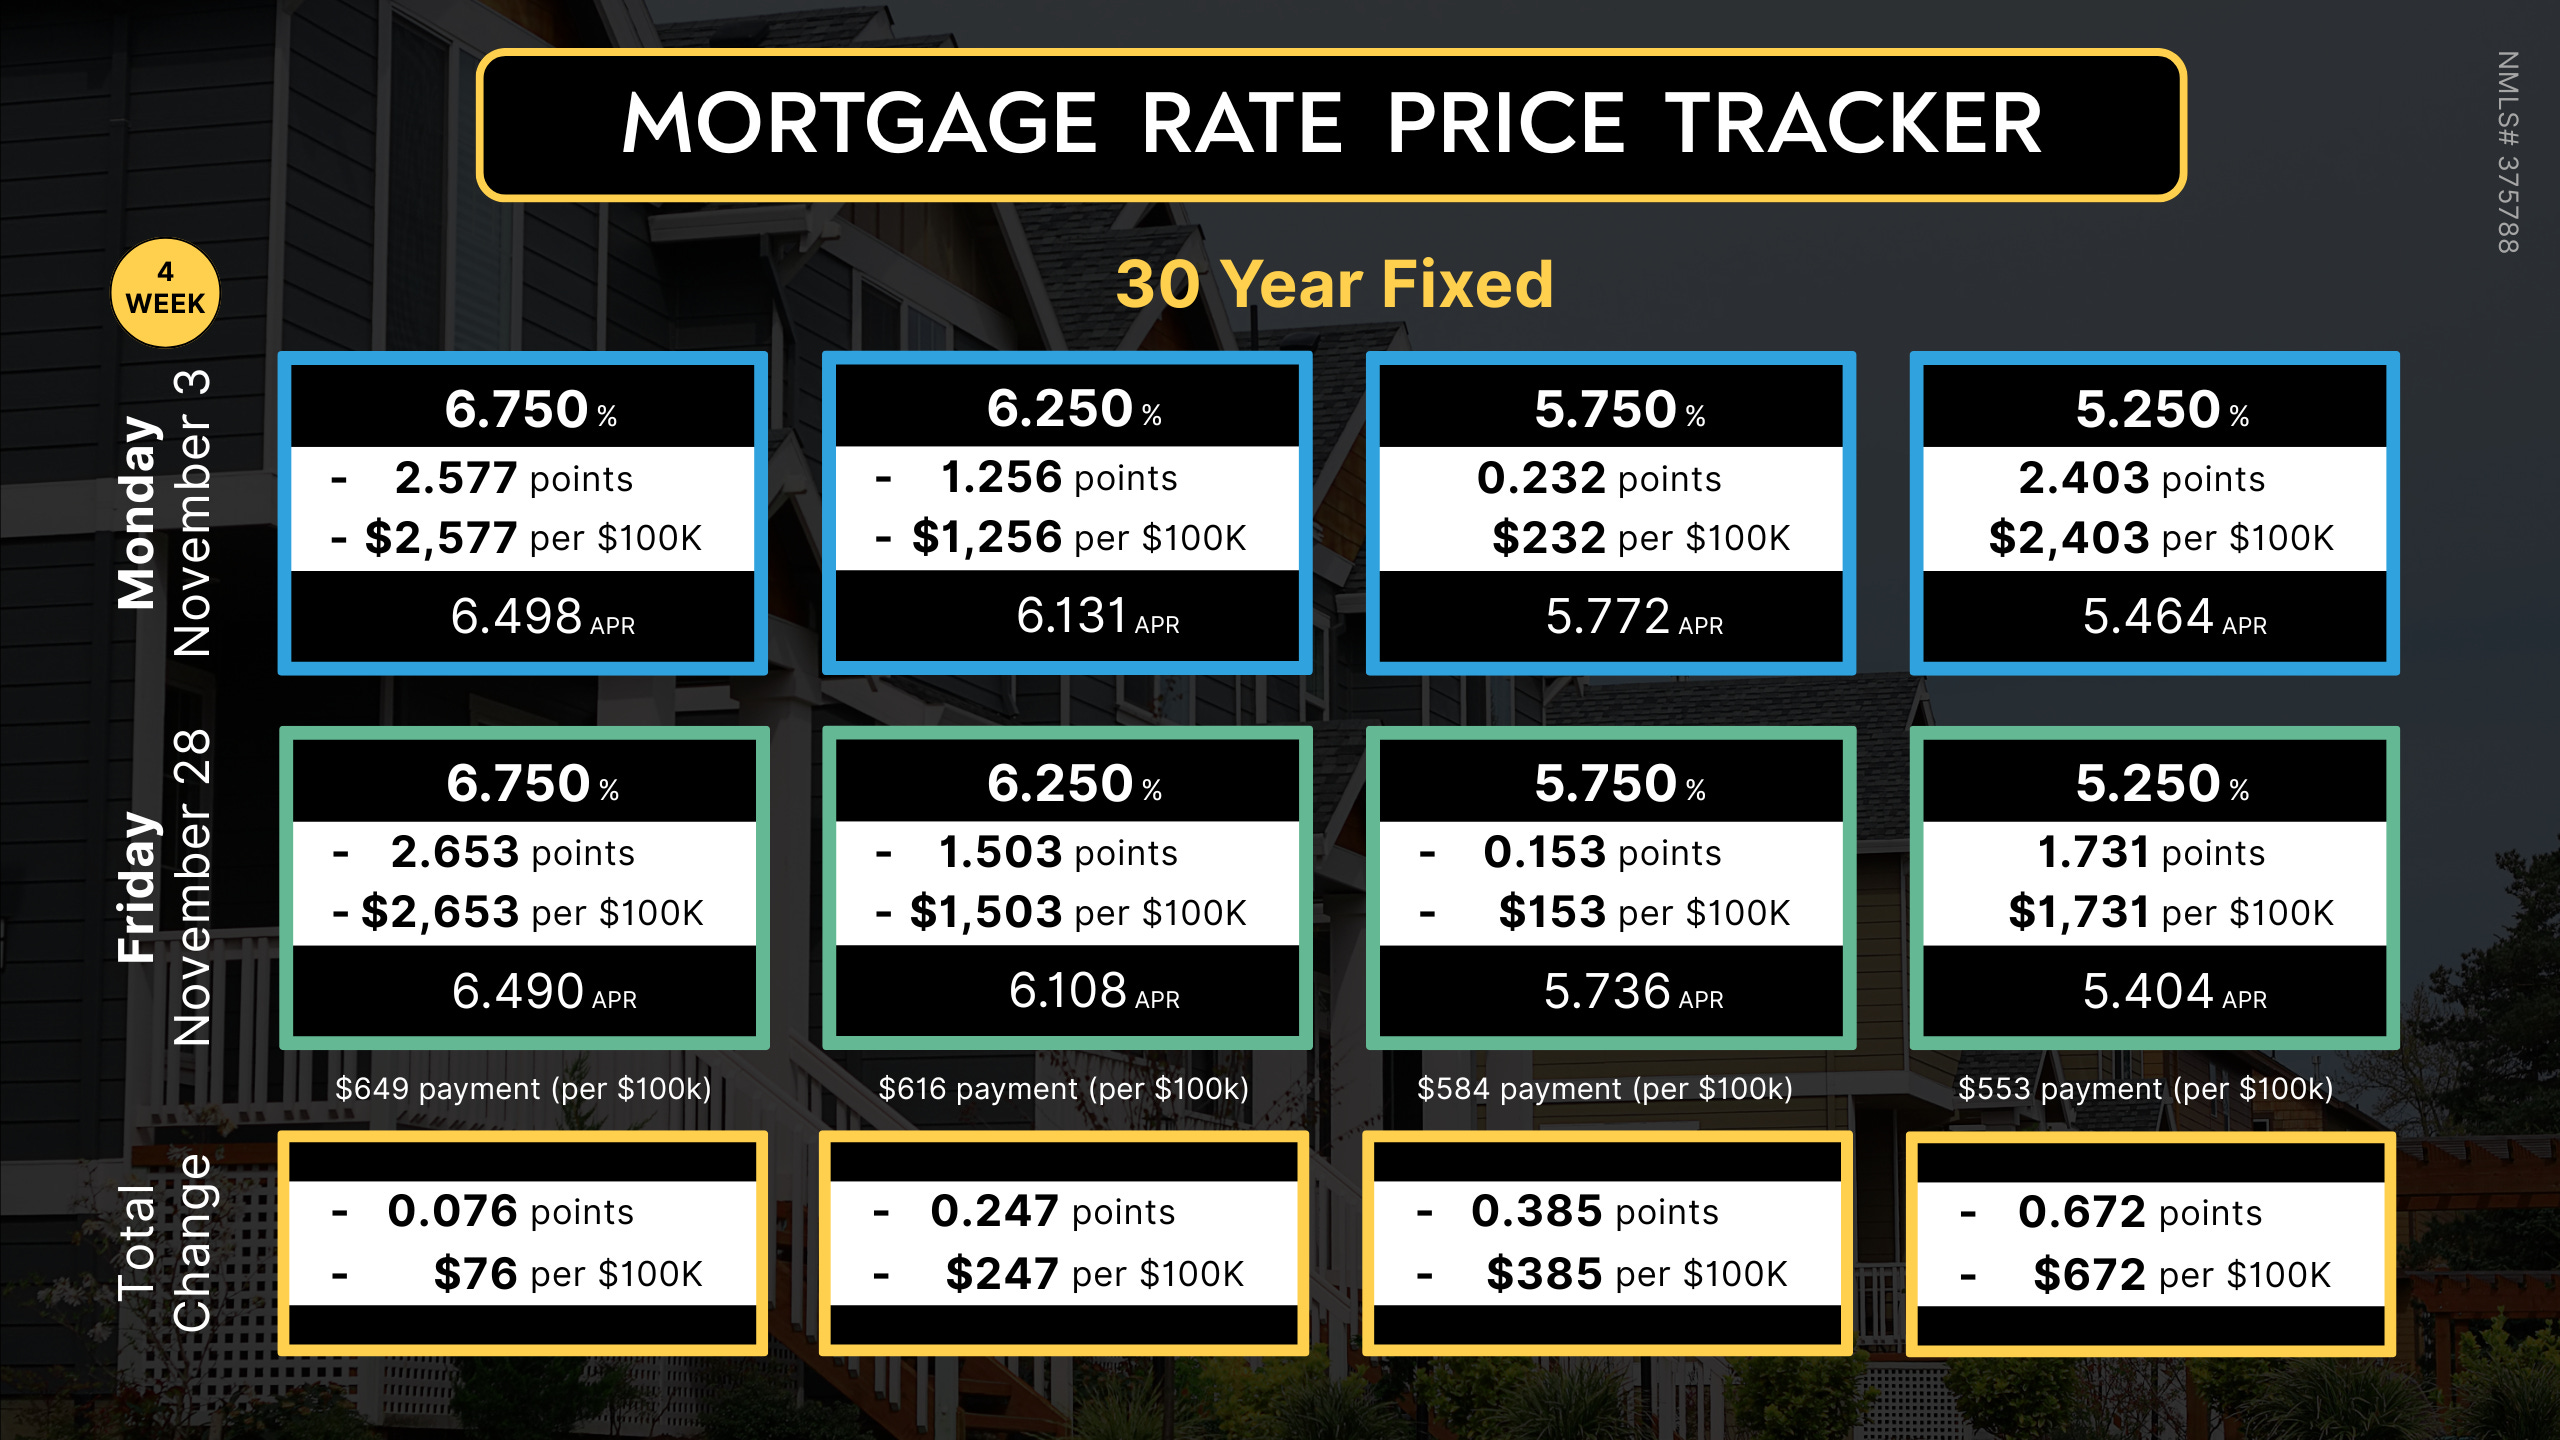
The LendZen Index monitors the change in price across a broad set of rates and mortgage bond coupons, whereas the Mortgage Rate Price Tracker is more “rate and loan program” specific.
Both are an example of how mortgage rates do not rise or fall, but instead it is their price that changes.
Since the LendZen Index has a variety of time series, the MRPT focuses on the current month’s activity.
You can explore the full results from November Week 4 on this Substack post.
MORTGAGE SPREADS 🧈
---------------------------
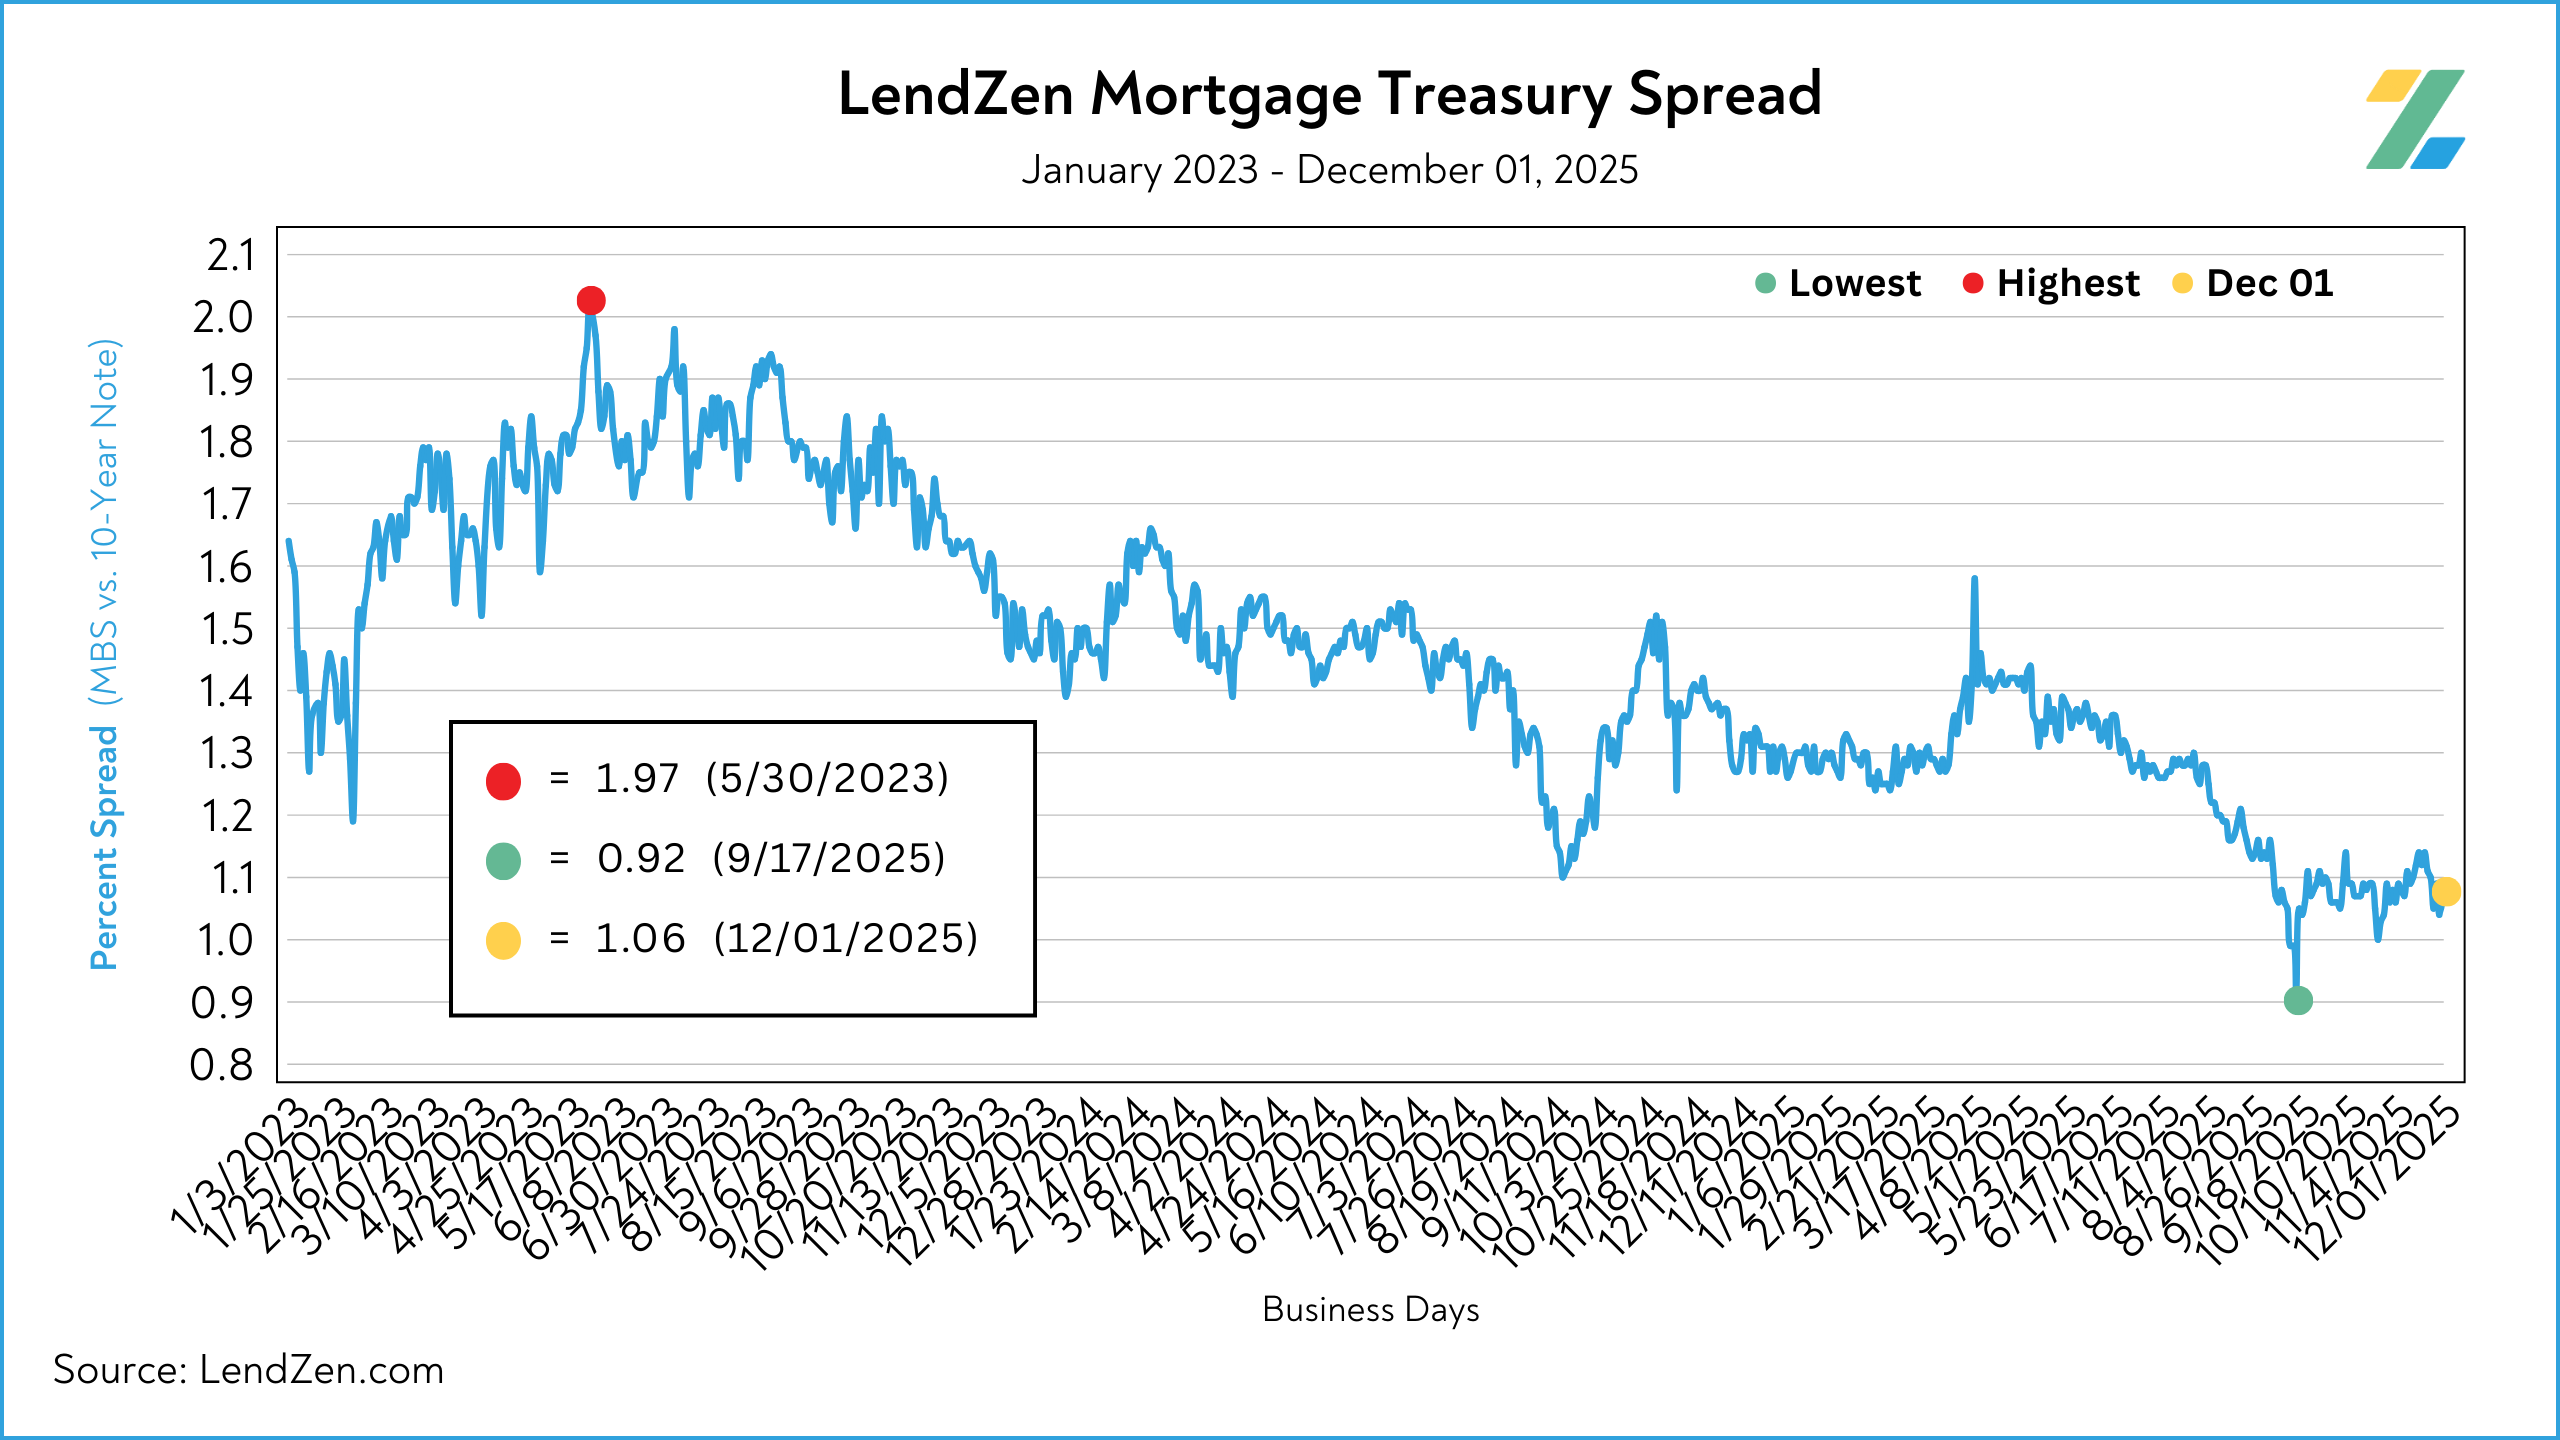
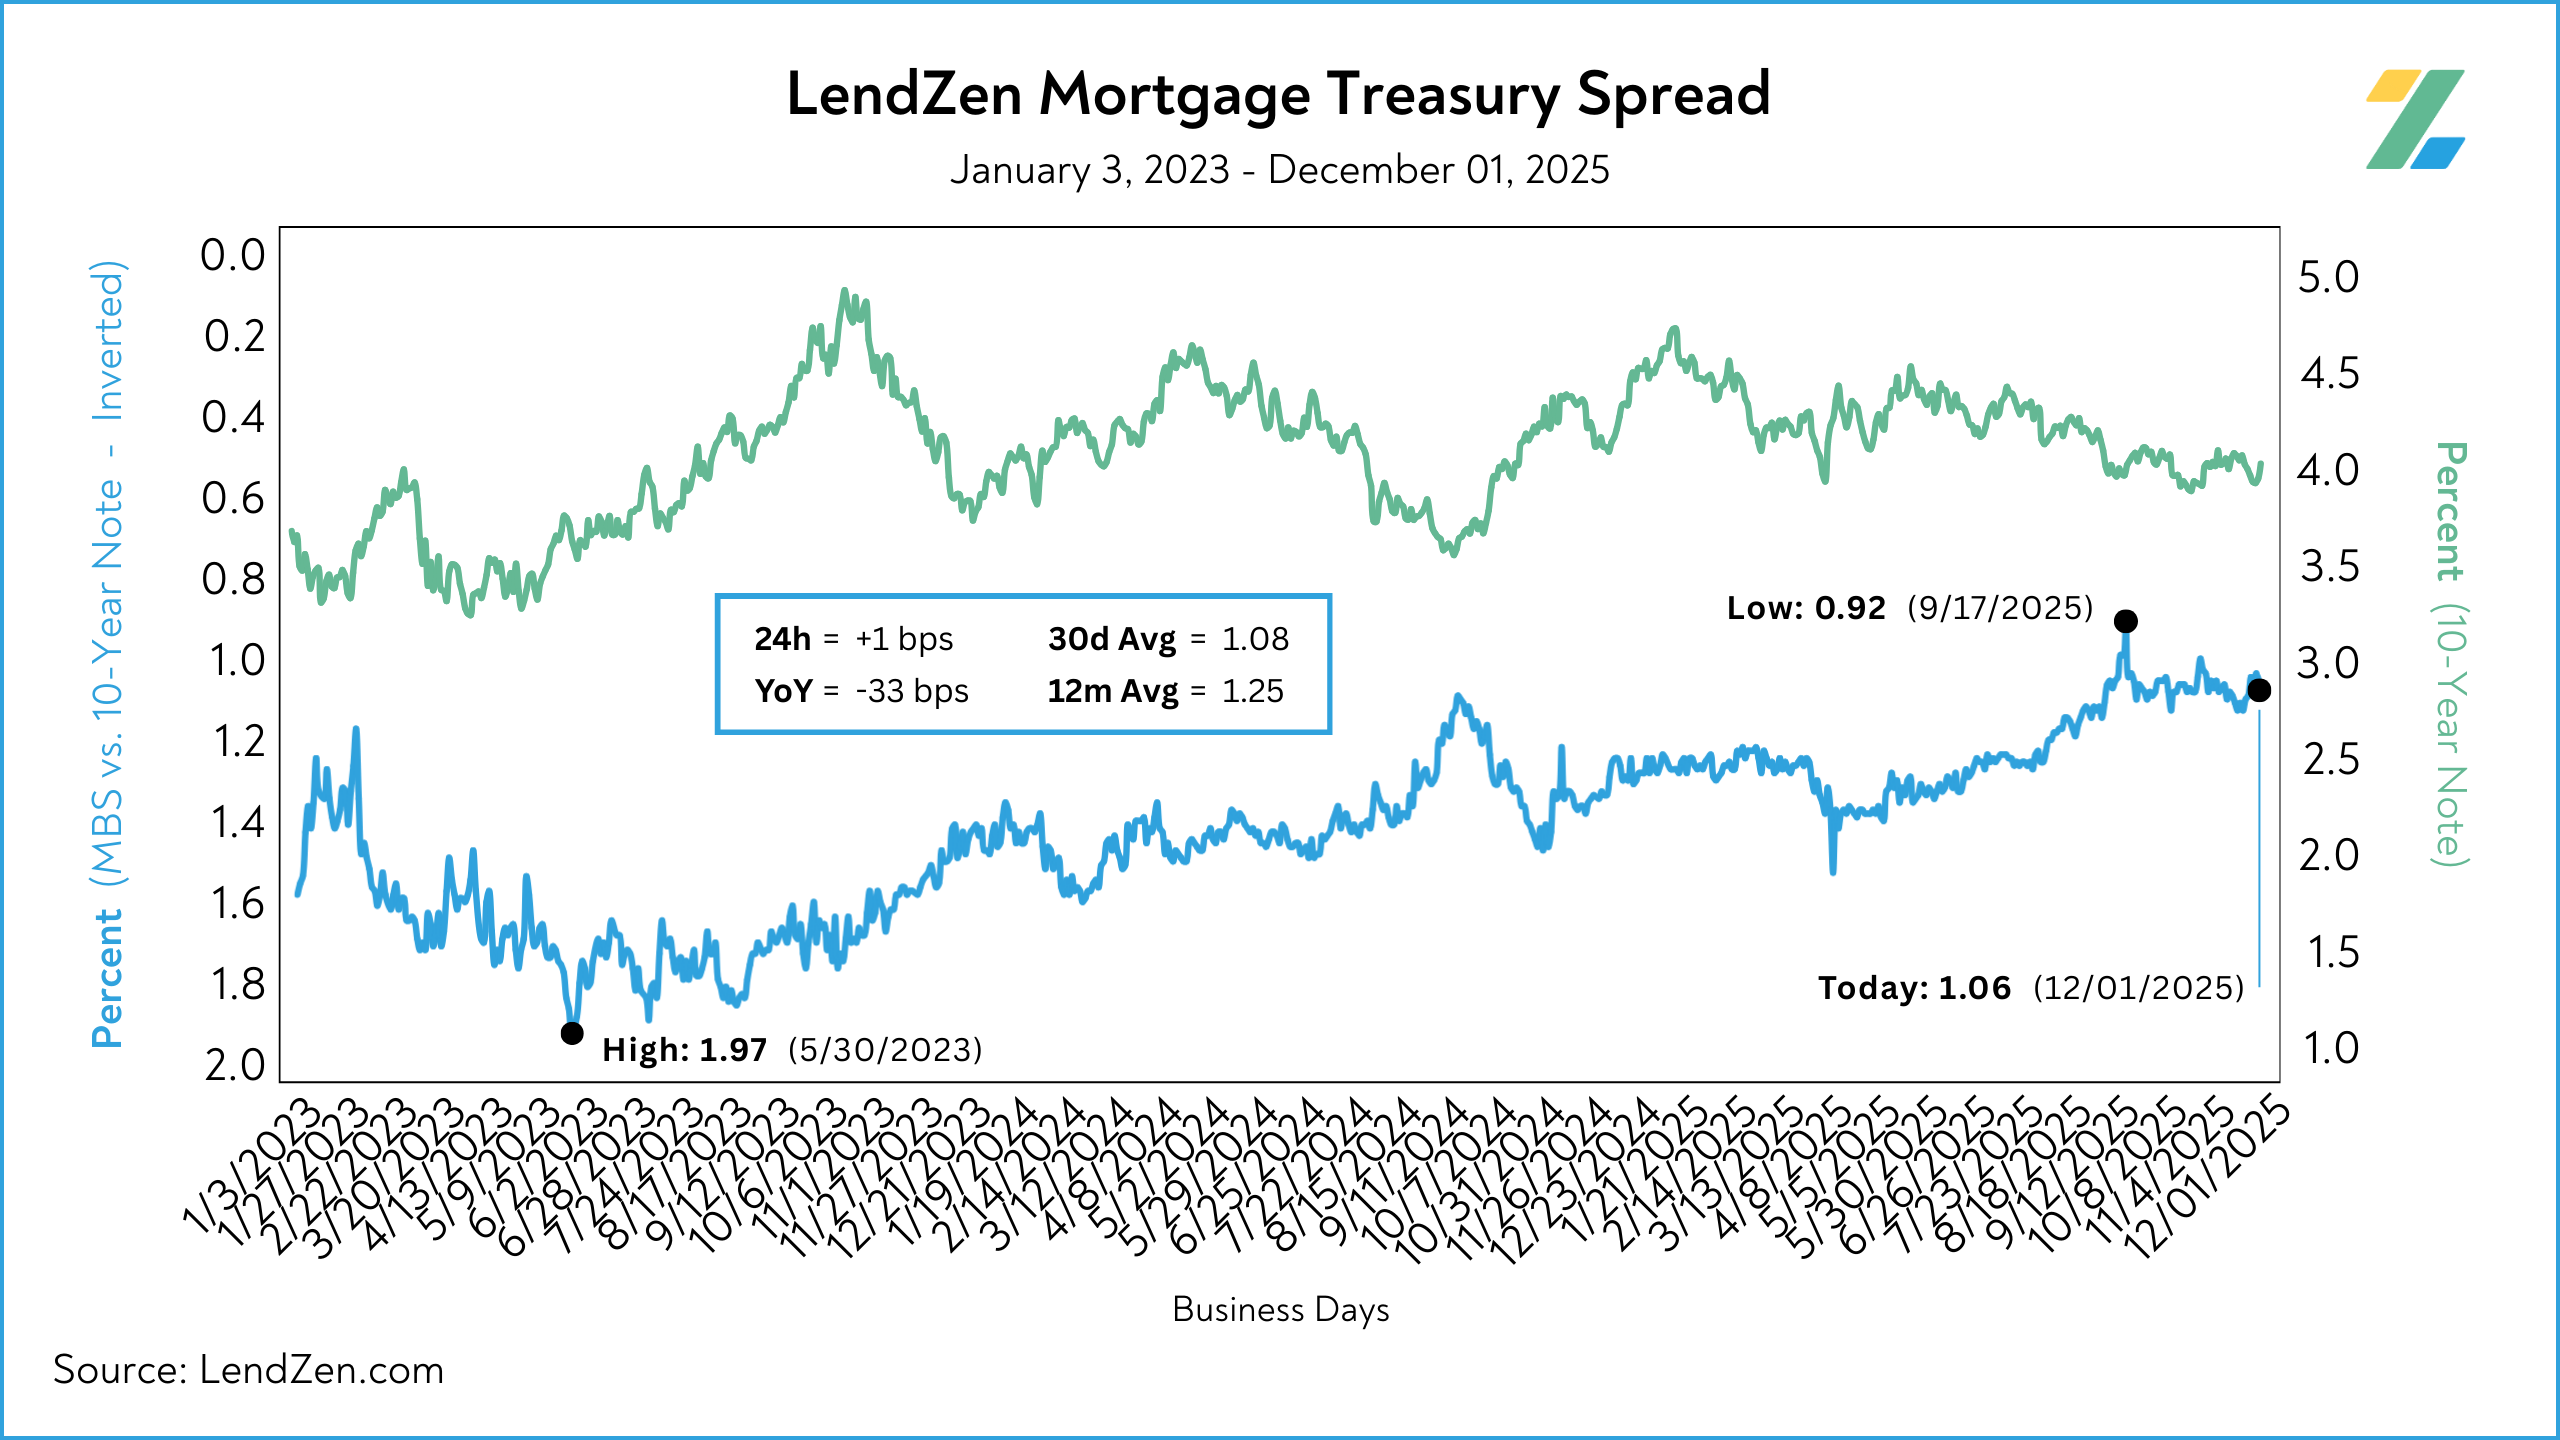
Published daily with the LendZen Index is the LendZen Mortgage-Treasury Spread.
The LMTS uses actual bond yields to create a historically consistent, and reliable, data set.
Learn more about the importance of accurately calculating spreads on this Substack post.
The spread between mortgage bonds and the U.S. 10-Year tightened 6-bps during the week.
Nov 24 = 1.10
Nov 28 = 1.04
30d Avg = 1.08
12m Avg = 1.25
YoY = - 34 bps (1.44)
HOUSING DATA 🏠
---------------------
Here are the latest housing market stats, with trends from the last 90 days.
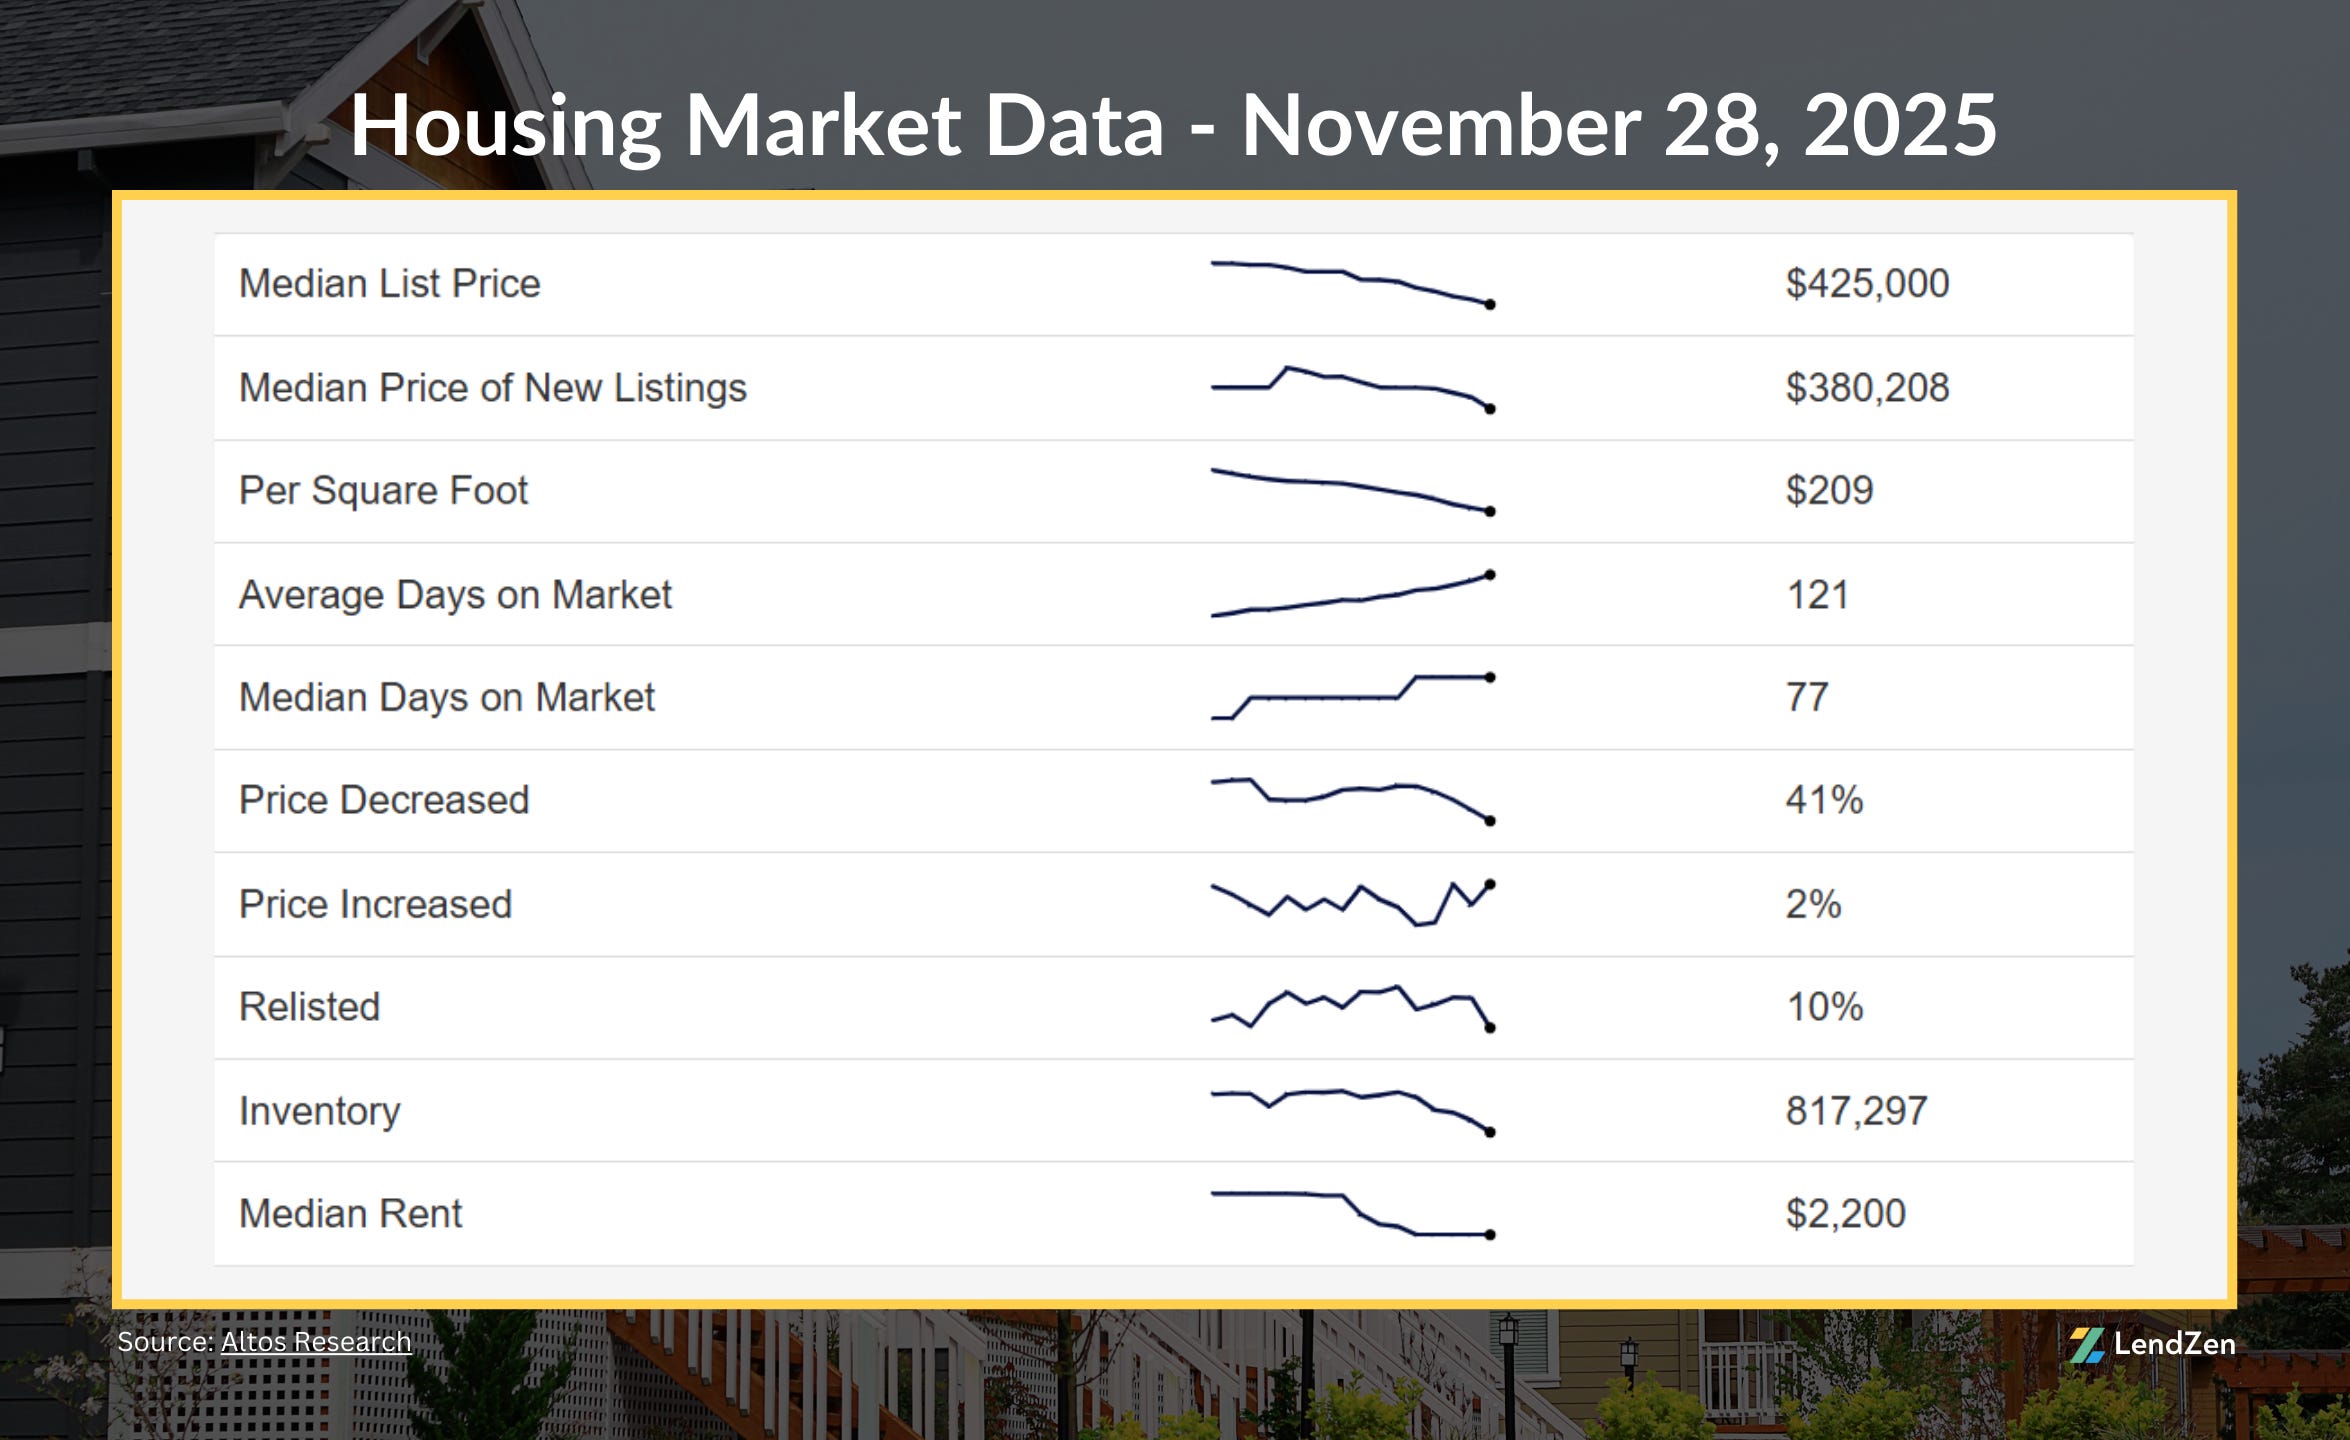
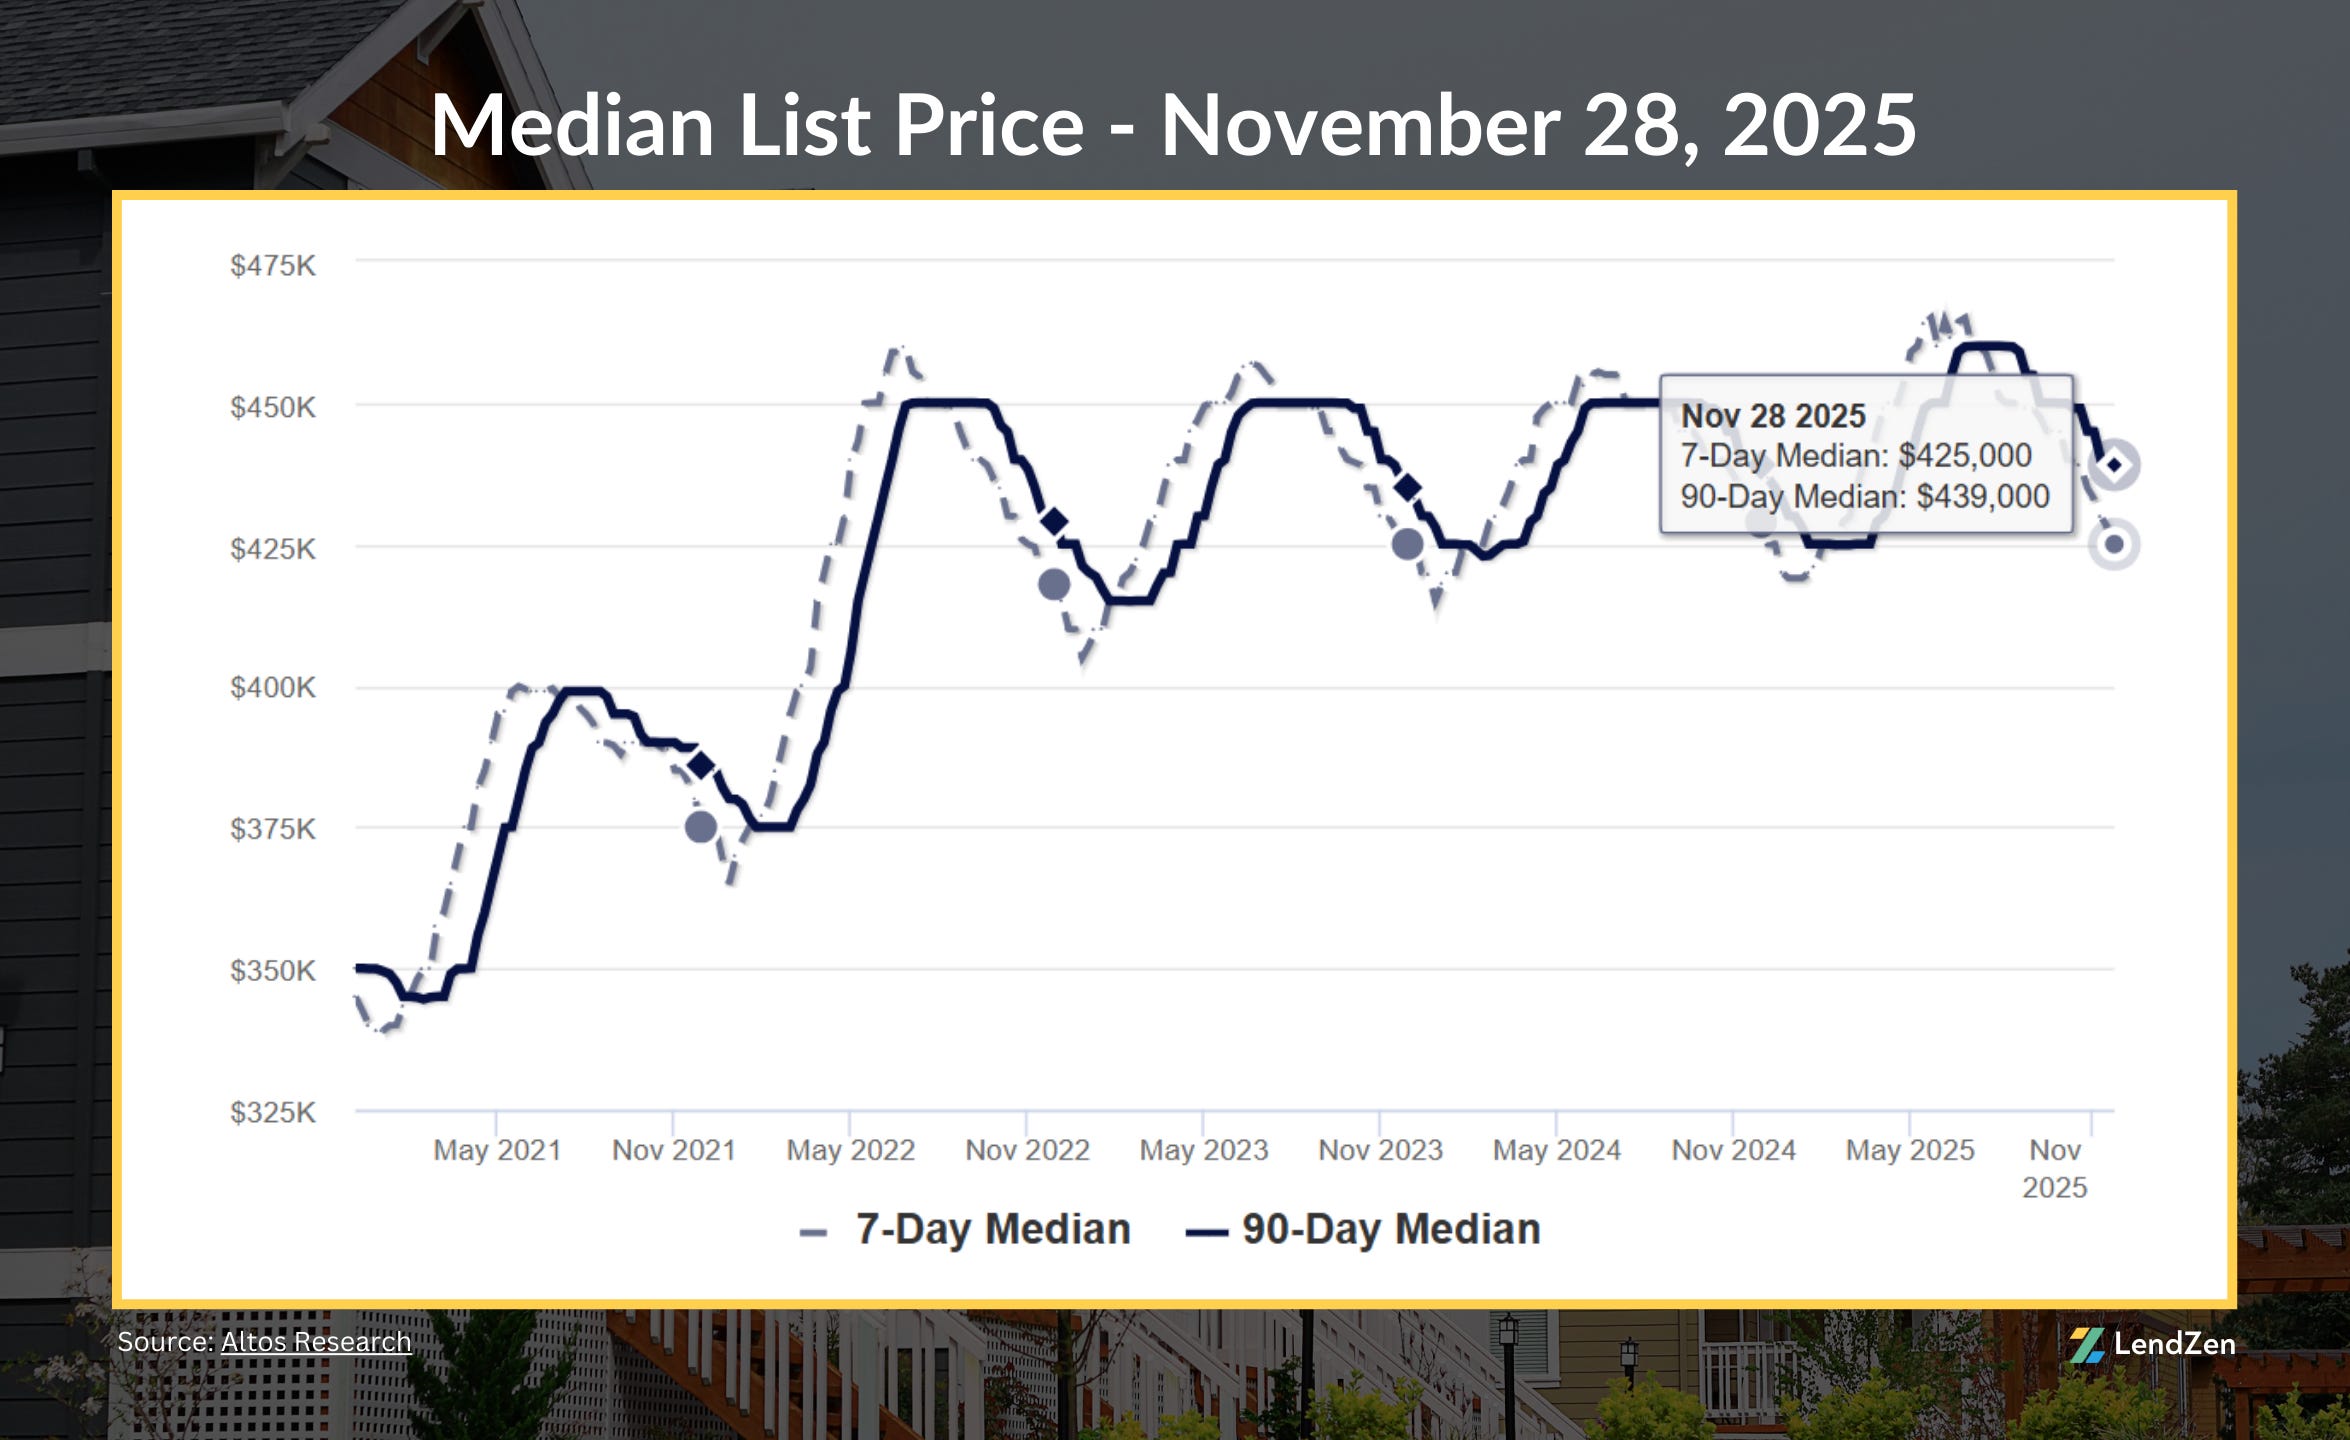
The U.S. median list price is $425,000, down 2/3 of percent (0.67) from last week.
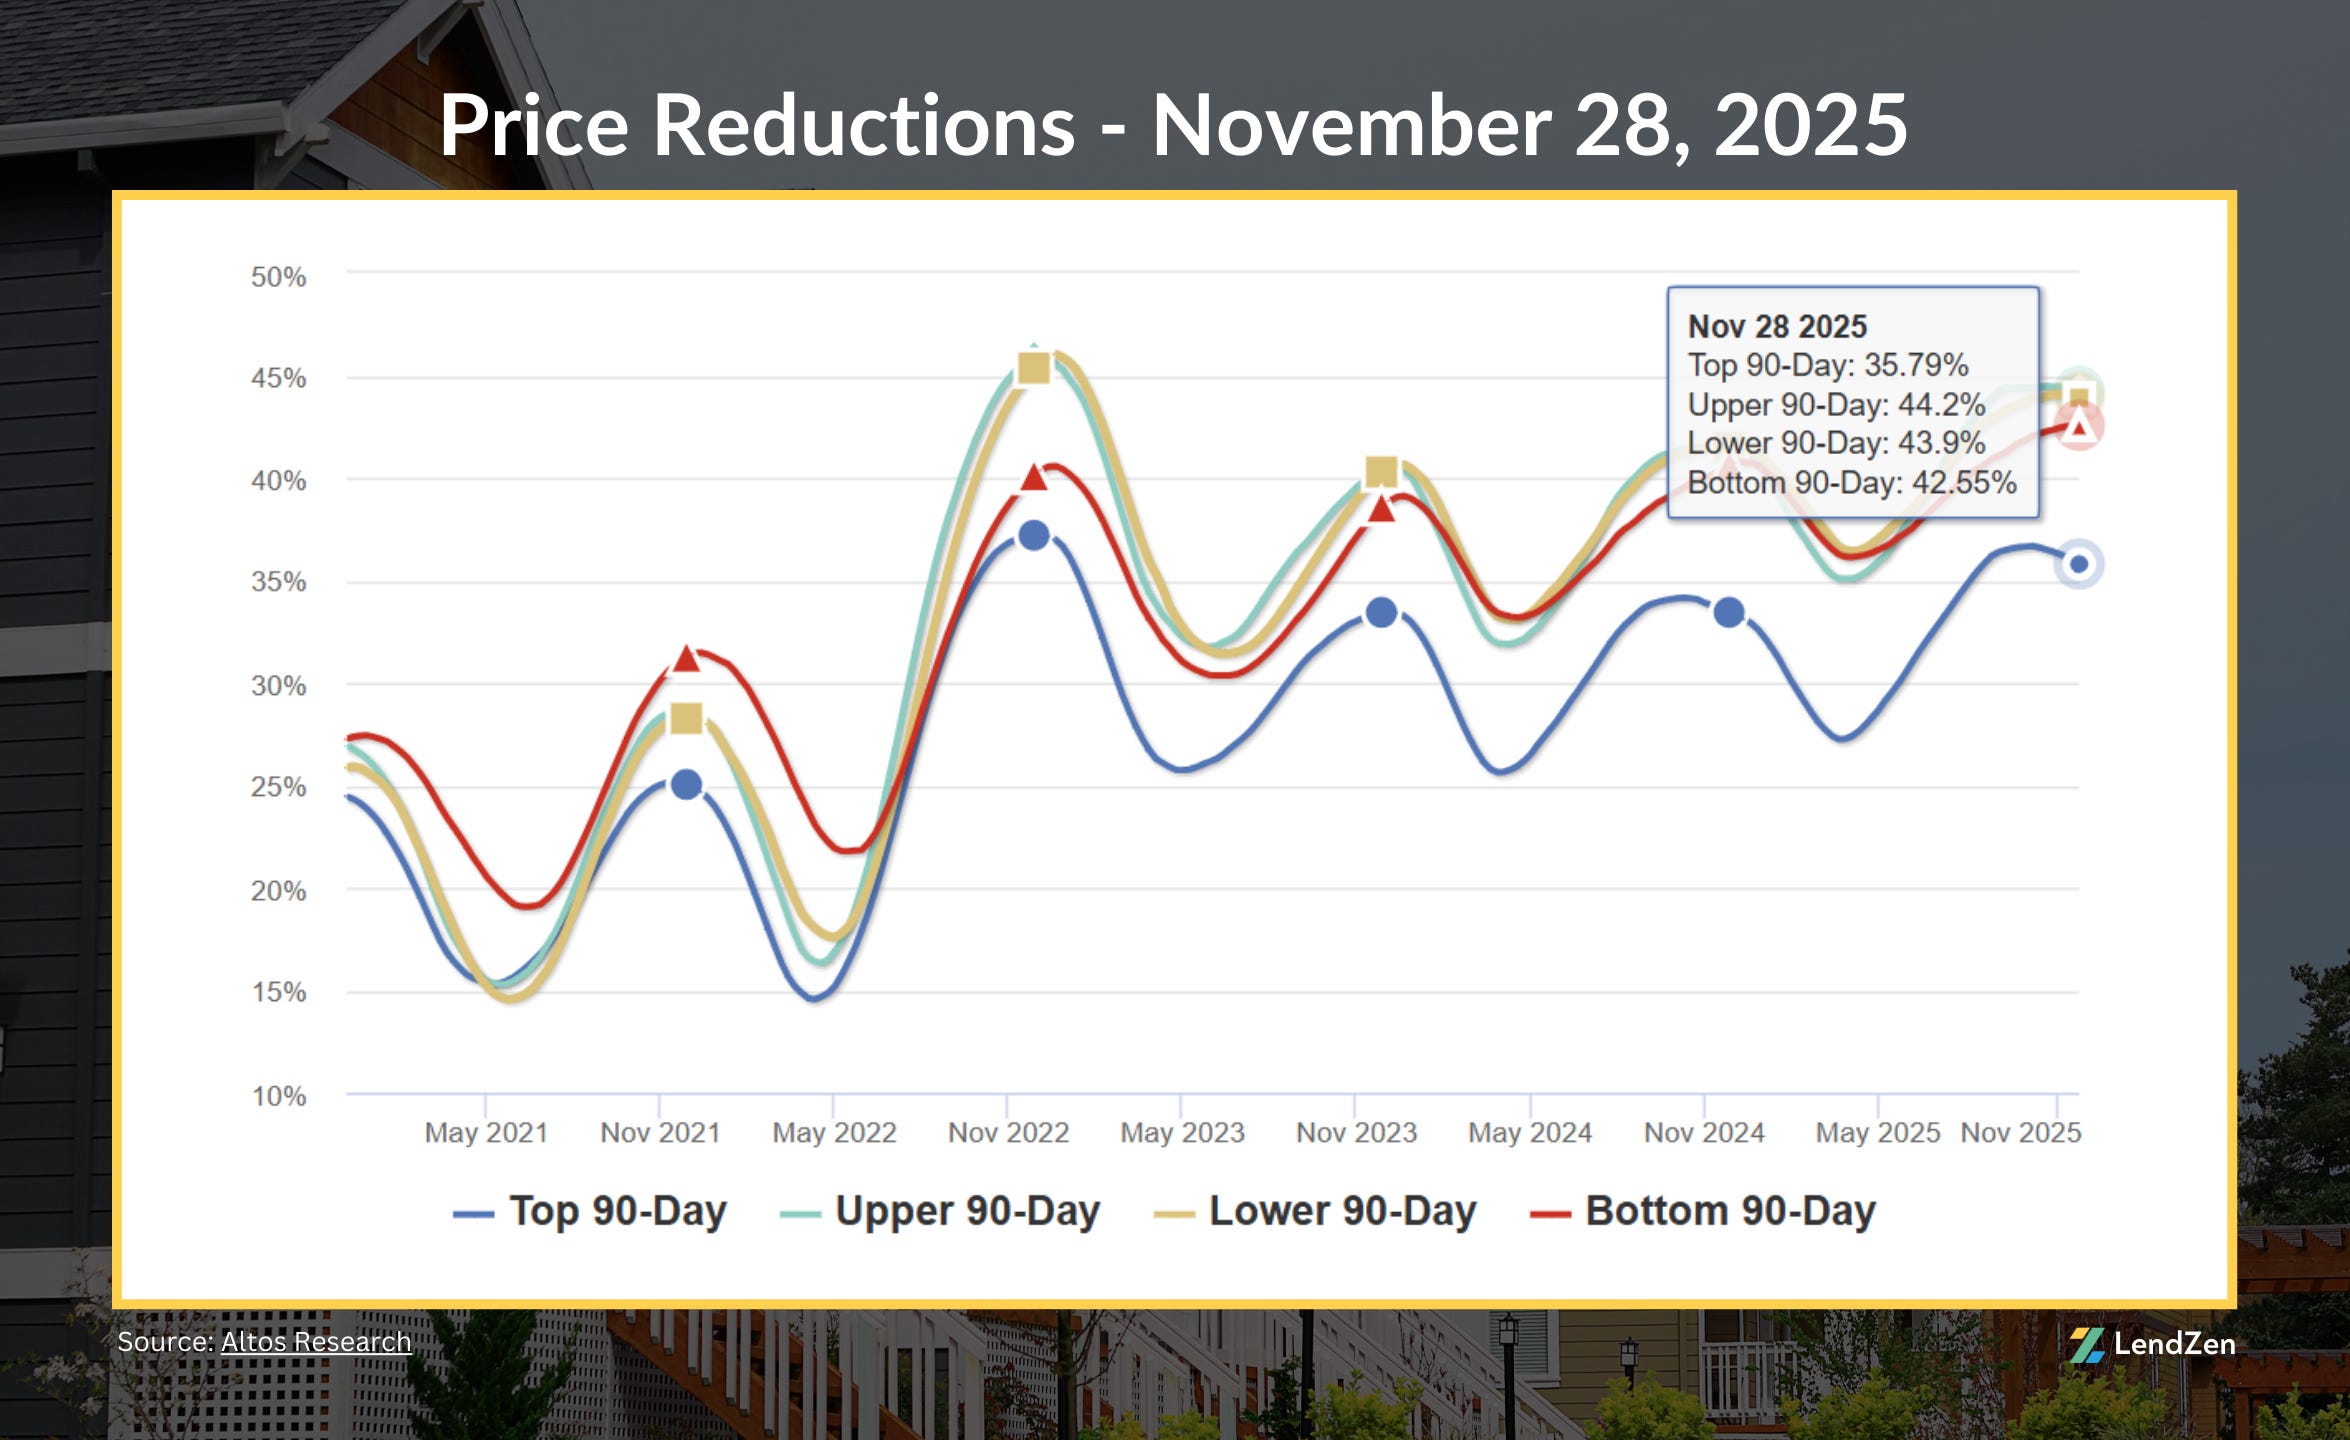
Price reductions remain steady with a 90-day national average of 41%.
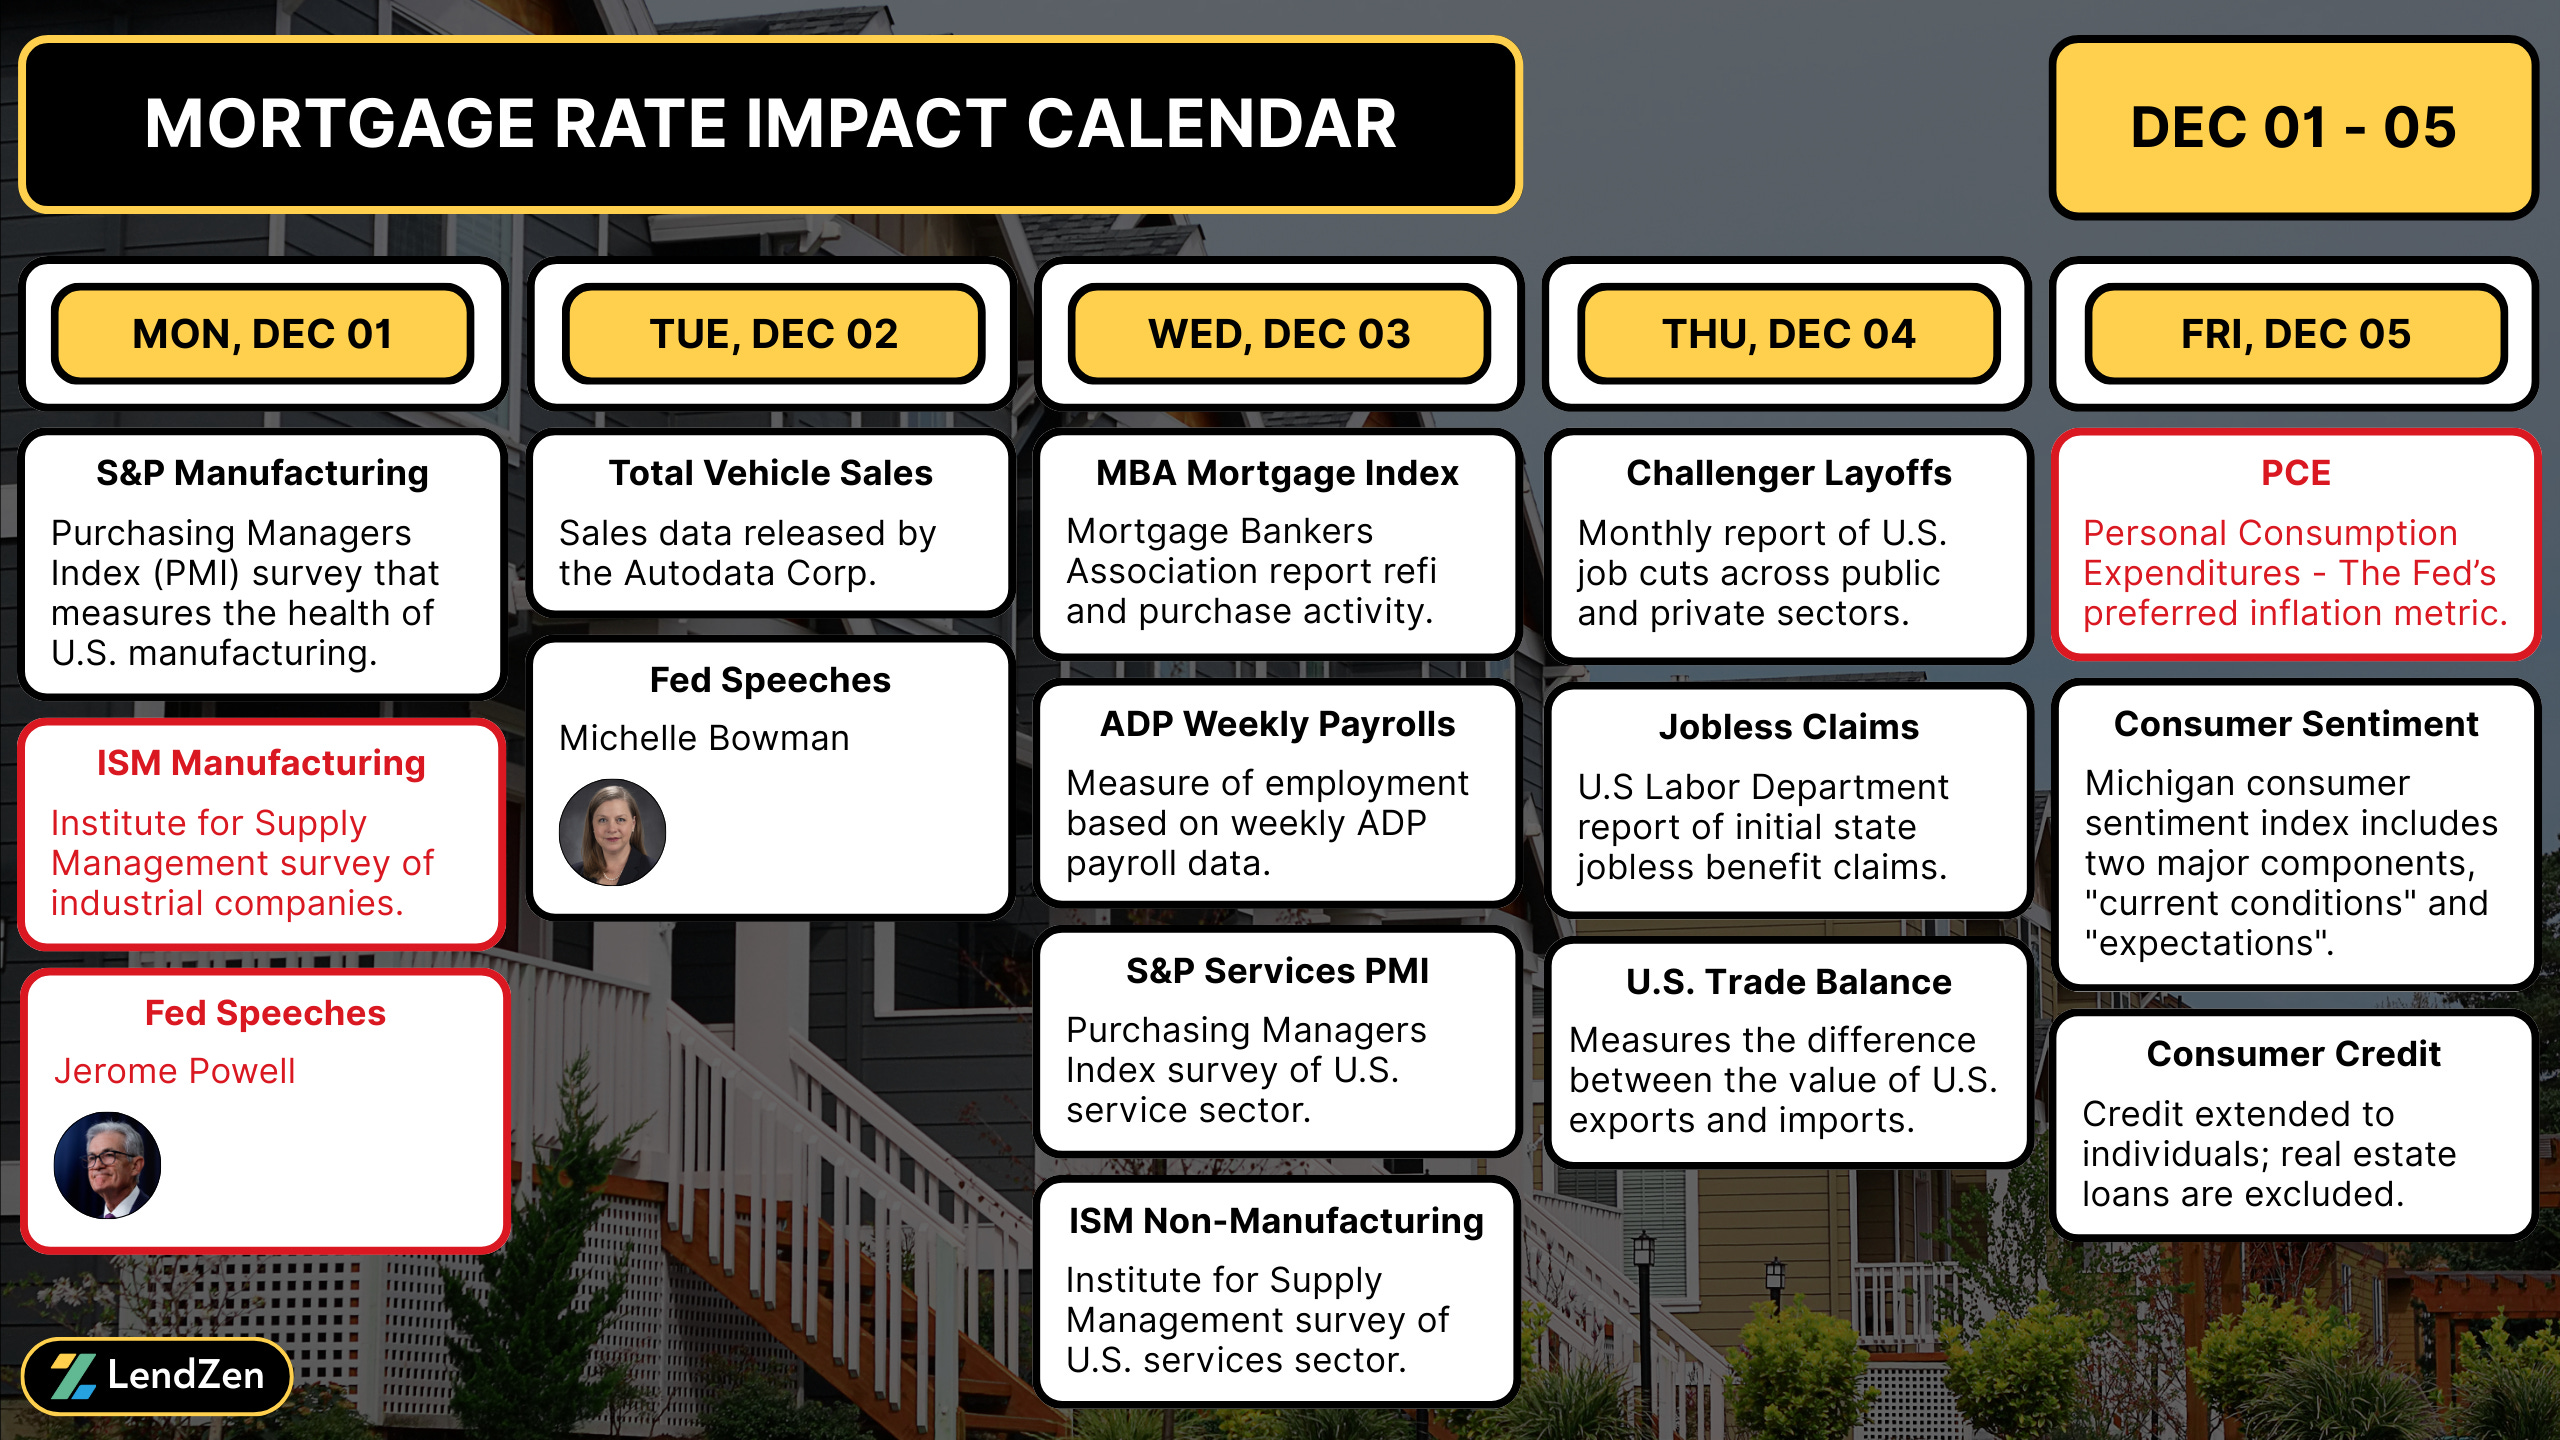
WEEK AHEAD 📅
------------------
This past week the Chicago Business PMI, which emphasizes the manufacturing sector, had one of its worst results since Covid.
The Chicago PMI at or below 45 has only occurred during a recession or immediately before. Since its inception in 1967, the latest 36.3 reading is already lower than the starting point for all 7 previous recessions.
Markets shrugged it off, perhaps because of holiday distractions, or maybe because they are waiting for further confirmation from the more heavily weighted Institute for Supply Management PMI survey on Monday.
Read more in yesterday’s Week Ahead.
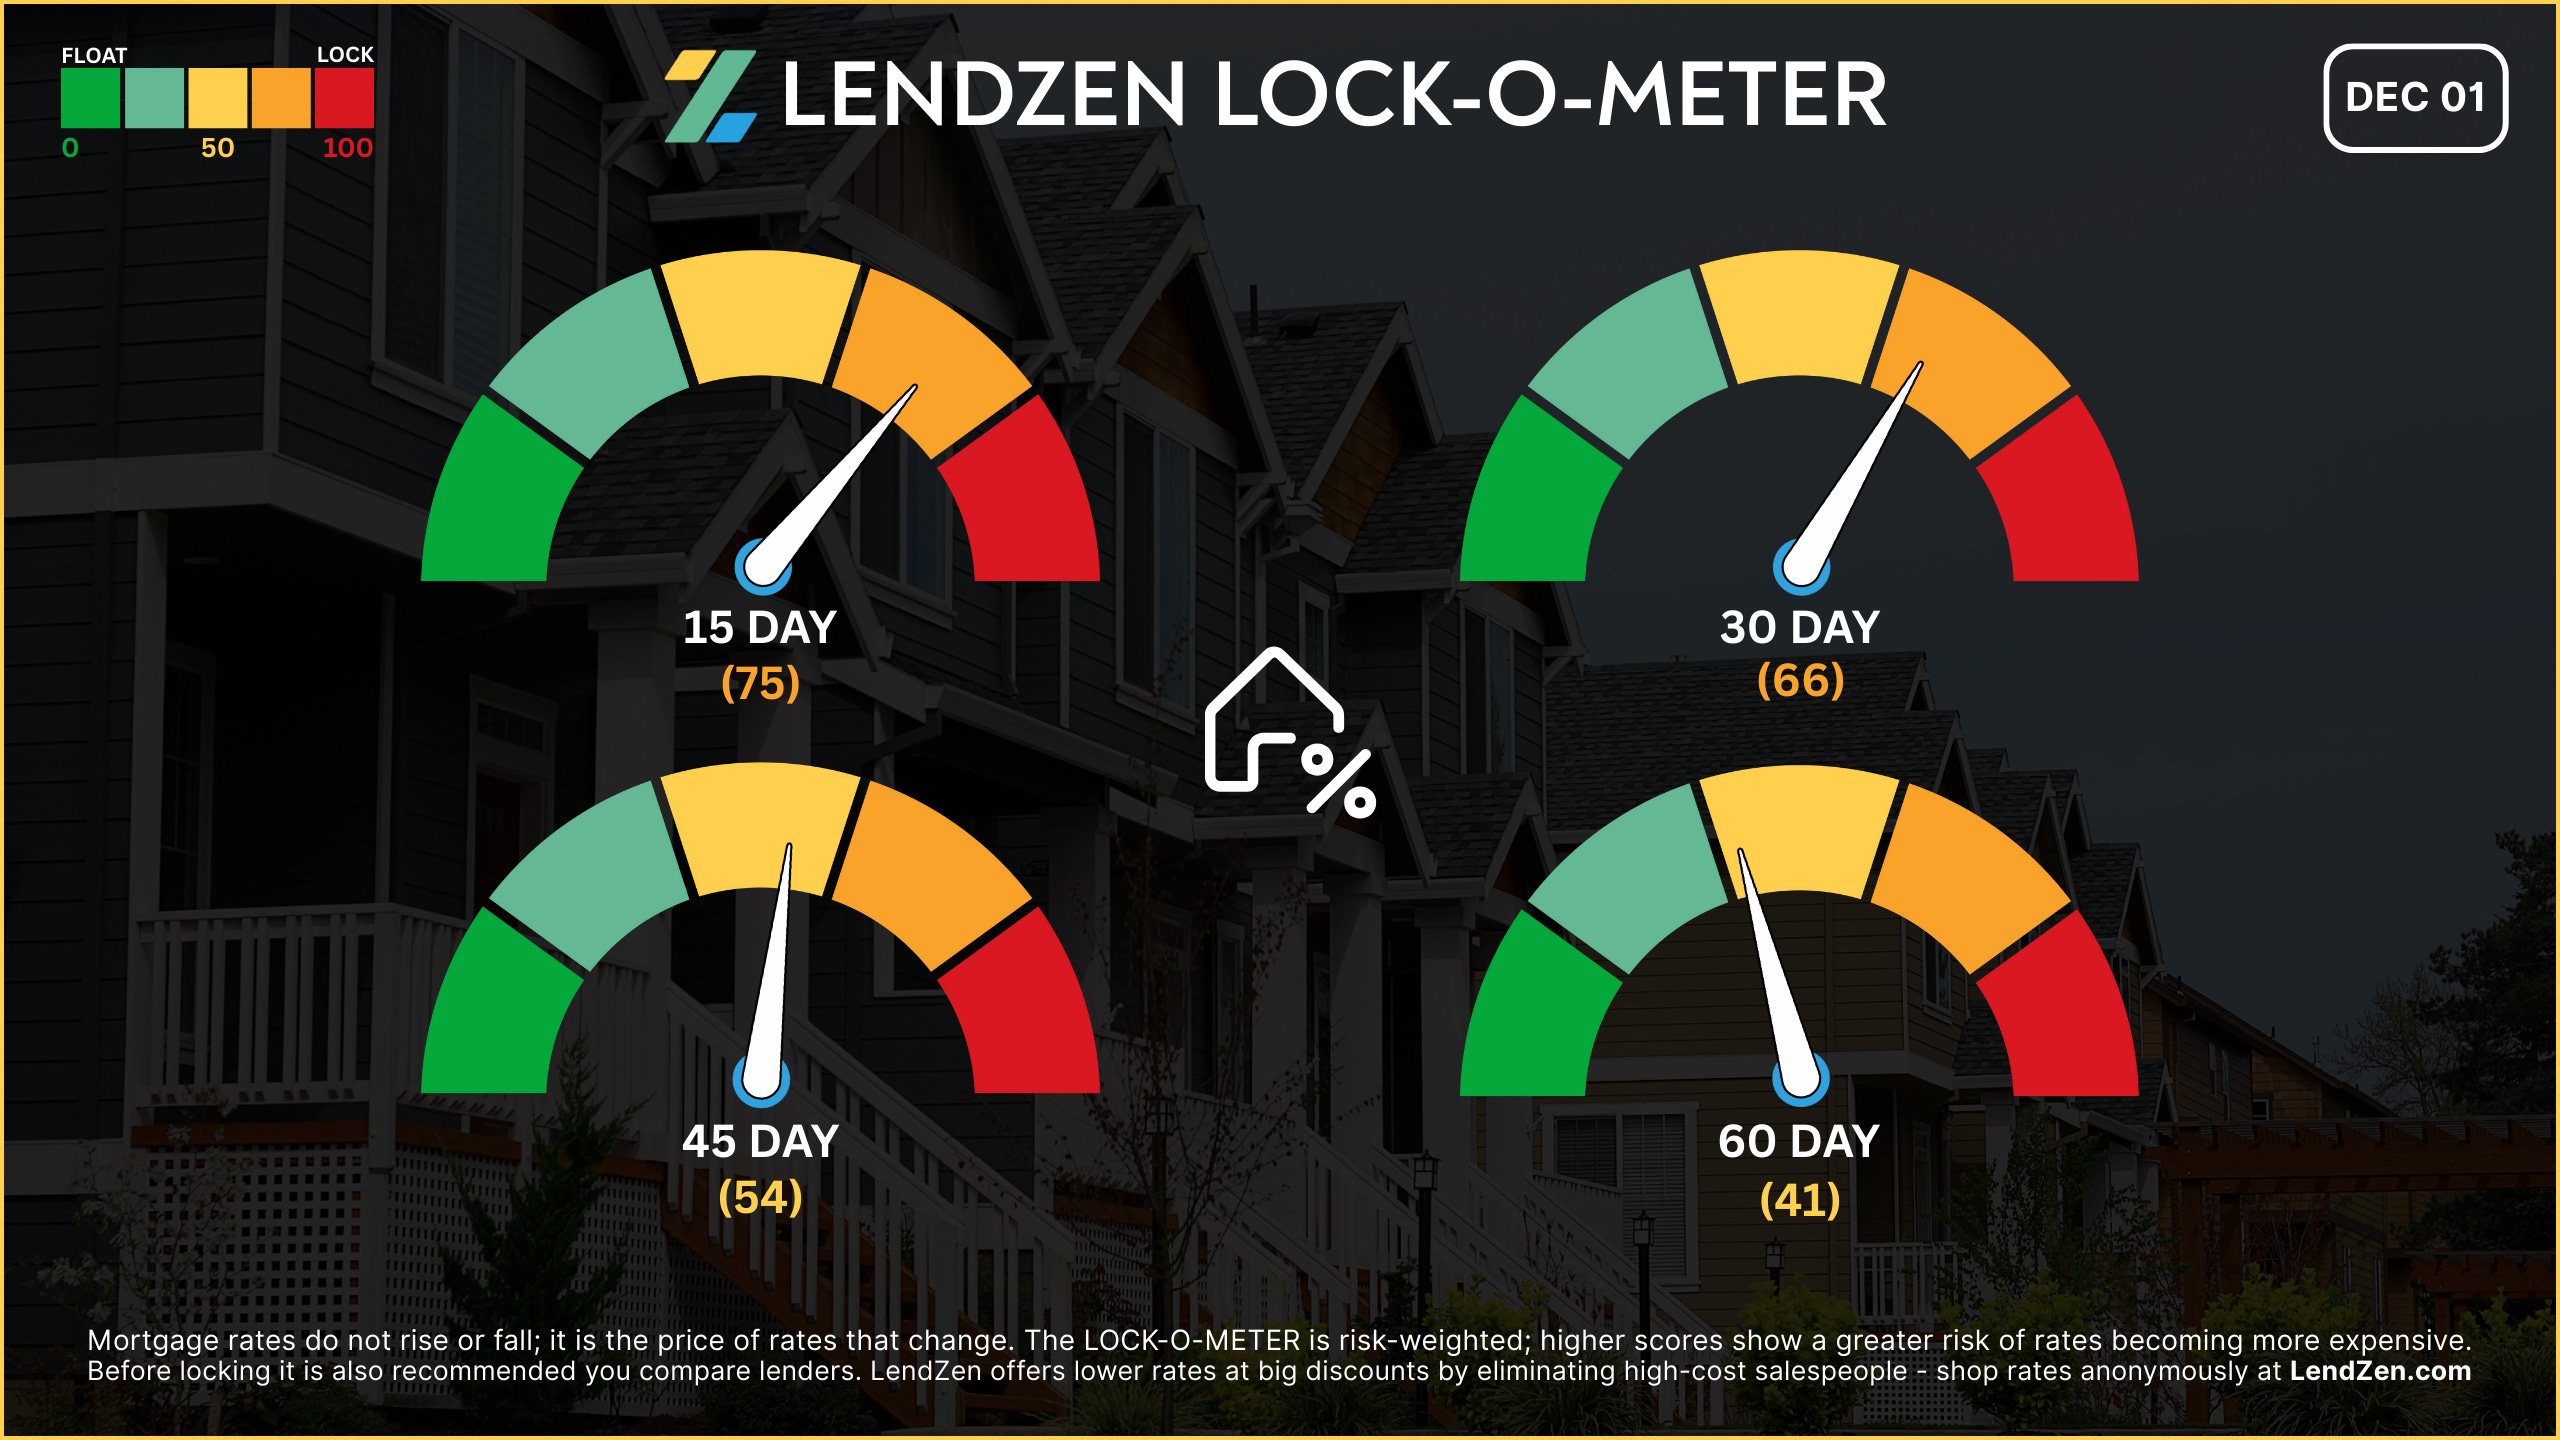
RATE LOCK GUIDE 🔒
---------------------
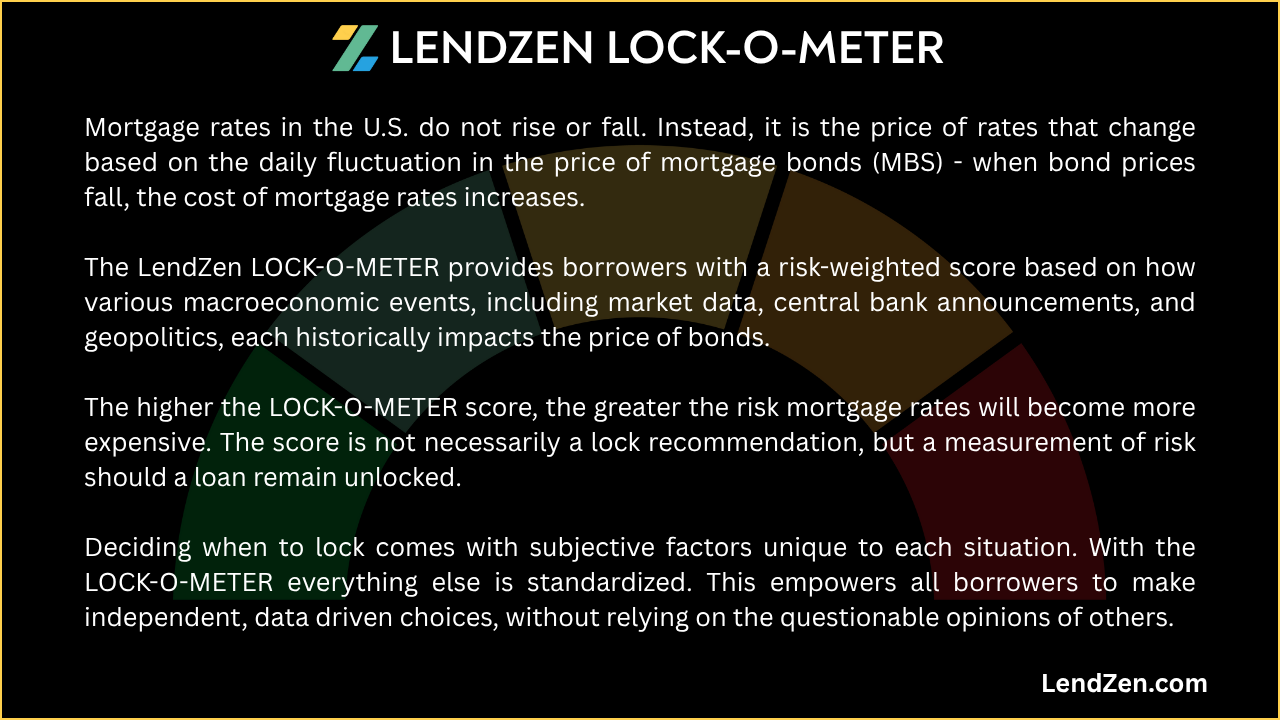
The LendZen LOCK-O-METER provides borrowers with a risk-weighted score based on how various macroeconomic events, including market data, central bank announcements, and geopolitics, each historically impacts the price of bonds.
higher risk scores = lean towards locking
------------------
Closing Window
------------------
[ 15 Days ] -- 75 🟠
The Fed’s rate decision is only a week away. With the November jobs report delayed until after the FOMC meeting, this week’s ISM report (Monday) and PCE inflation (this Friday) will steal the show. Highly concentrated event driven risk in such a short window keeps lock urgency elevated.
[ 30 Days ] -- 66 🟠
While rate movement has been generally favorable, the next 2 weeks include manufacturing and service sectors data, PCE, and a highly anticipated Fed rate decision. Each of these could result in volatility - less risk than 15-day but still in the caution zone.
[ 45 Days ] -- 54 🟡
Rate momentum has stabilized after a wild October end. Barring any upside surprises in inflation, there’s more flexibility beyond the Fed meeting, but the risk of reversal is still present.
[ 60 Days ] -- 41 🟡
Intermediate trend remains favorable. The LendZen Index shows continued improvement as recession risks resurface. The November NFP data and December FOMC are the main events to watch heading into the final stretch of 2025.
If you are already in a strong position locking generally makes the most sense, especially for shorter windows, since the focus should be on making a savvy rate choice based on your longer-term rate outlook.
I expand on this “long game” approach in this Substack post.

Thanks for reading.
If you want to shop real-time mortgage rates and get instant qualification results without providing any contact information visit LendZen.com
LendZen provides a fully automated mortgage shopping experience that gives you anonymous access to all mortgage rates with full transparency of costs upfront as bond prices change.

LendZen Inc. is an equal opportunity mortgage lender, NMLS 375788.